2024-01-09
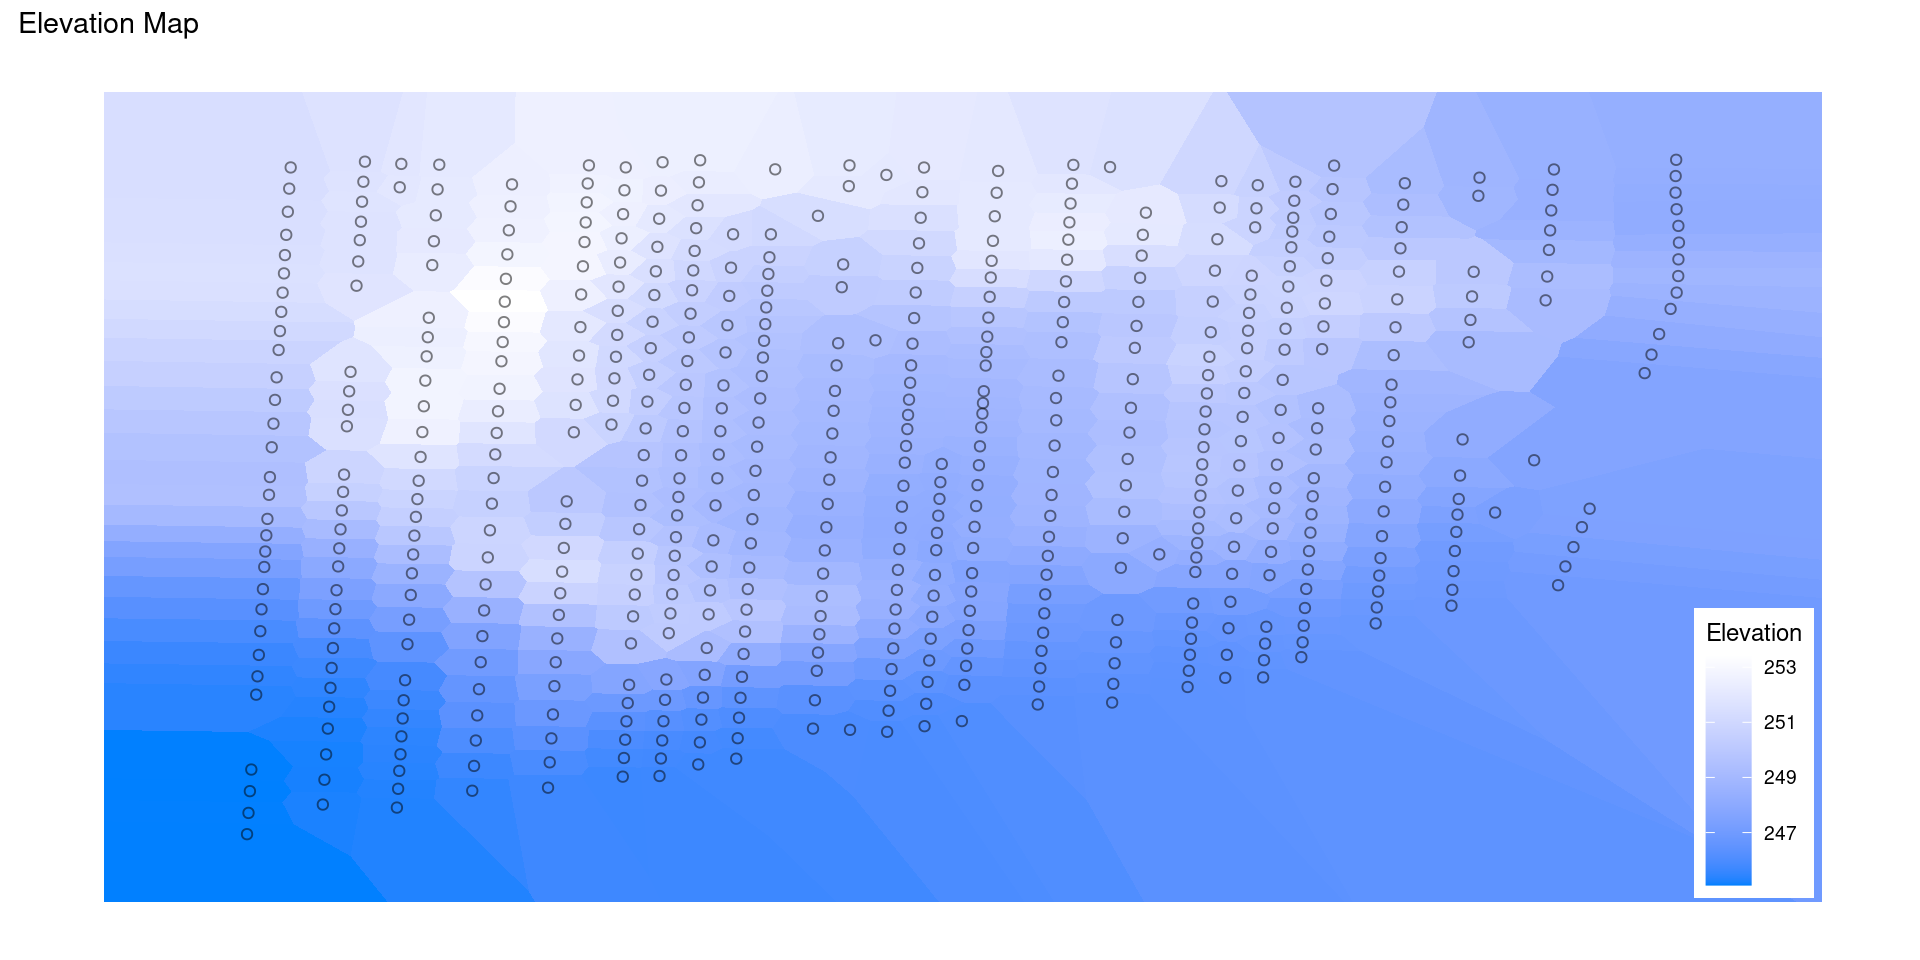
Data is easier to understand visually
Build trust in models and results
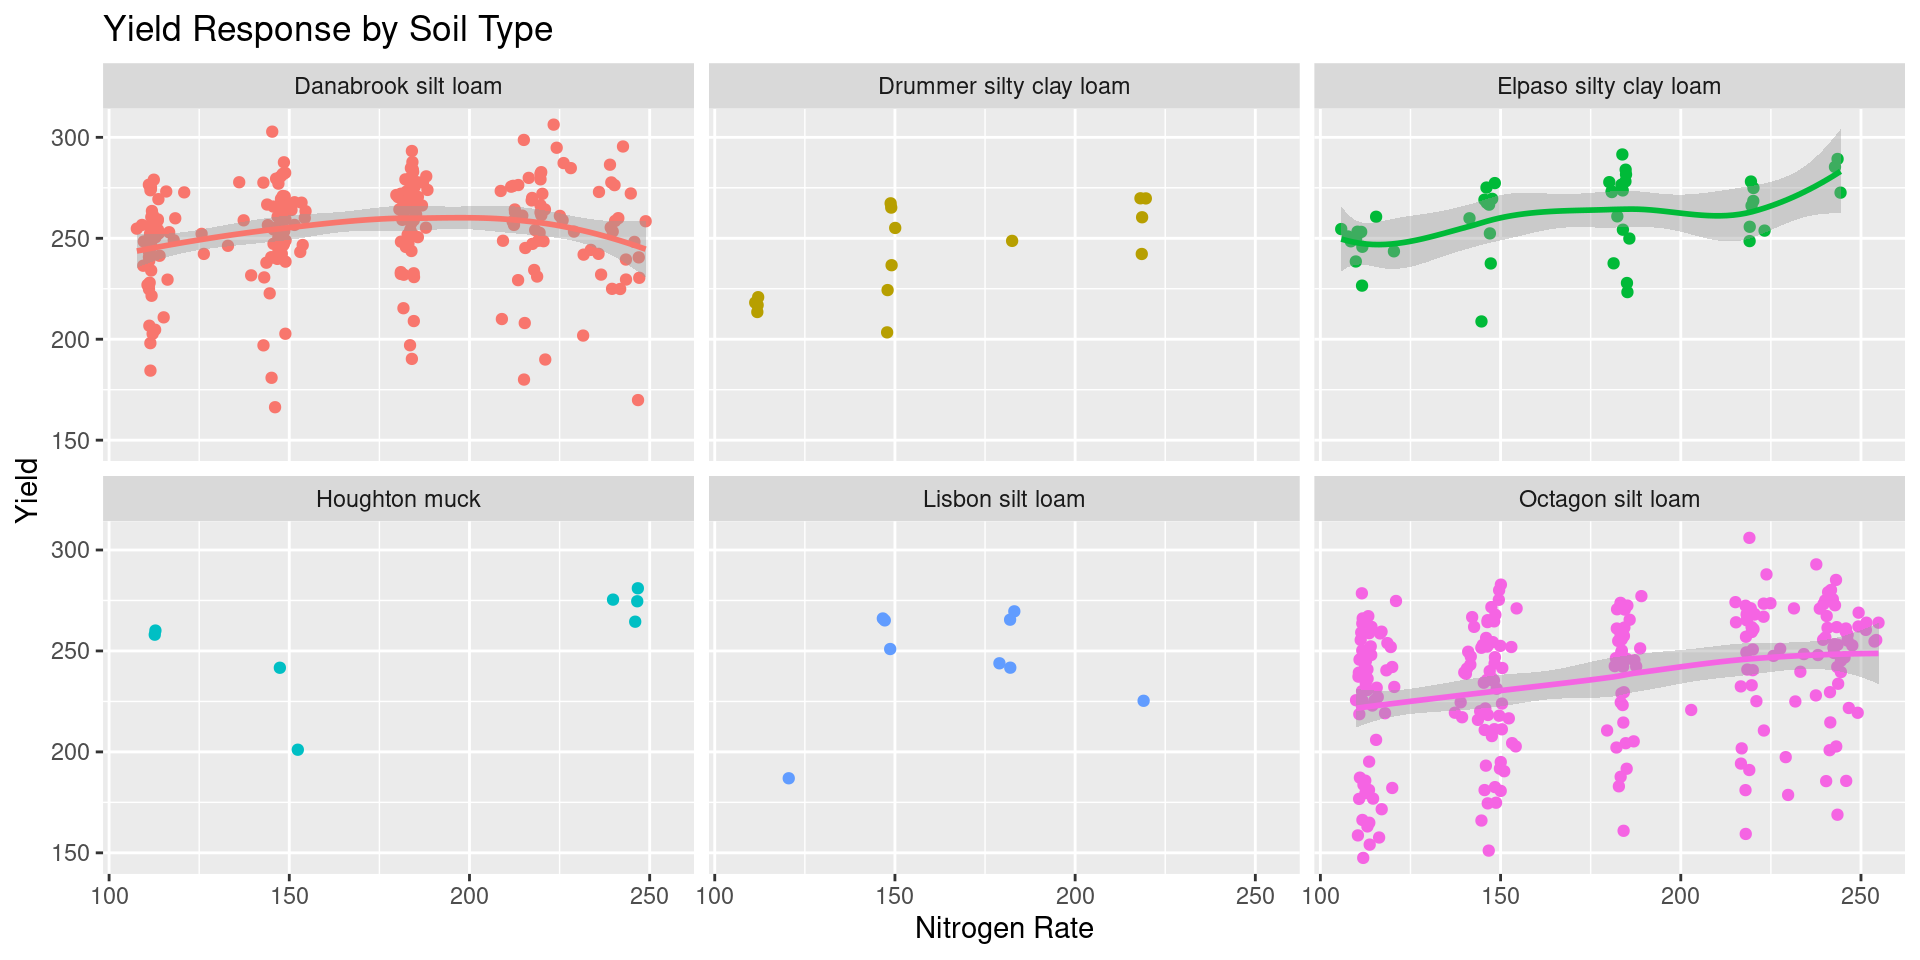
Identify patterns, trends, outliers
Identify issues with data quality/import (“gut check”)
Look at raw data
Develop initial hypotheses and questions
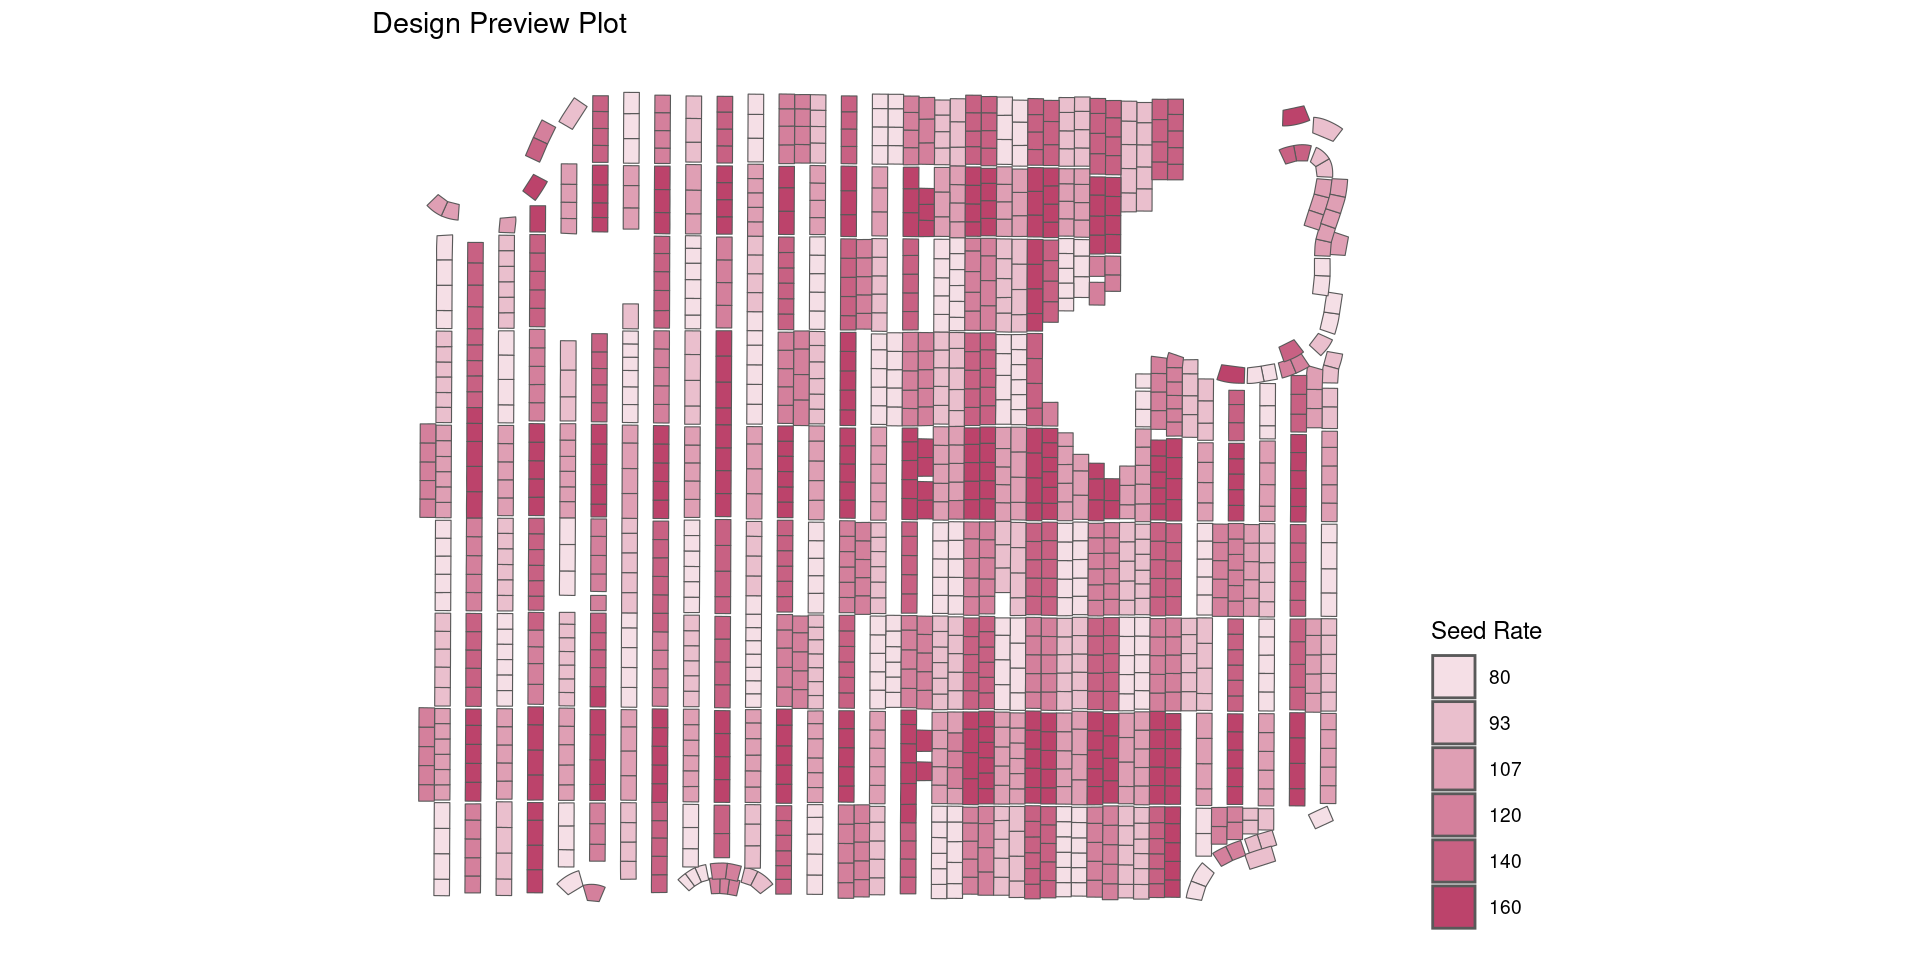
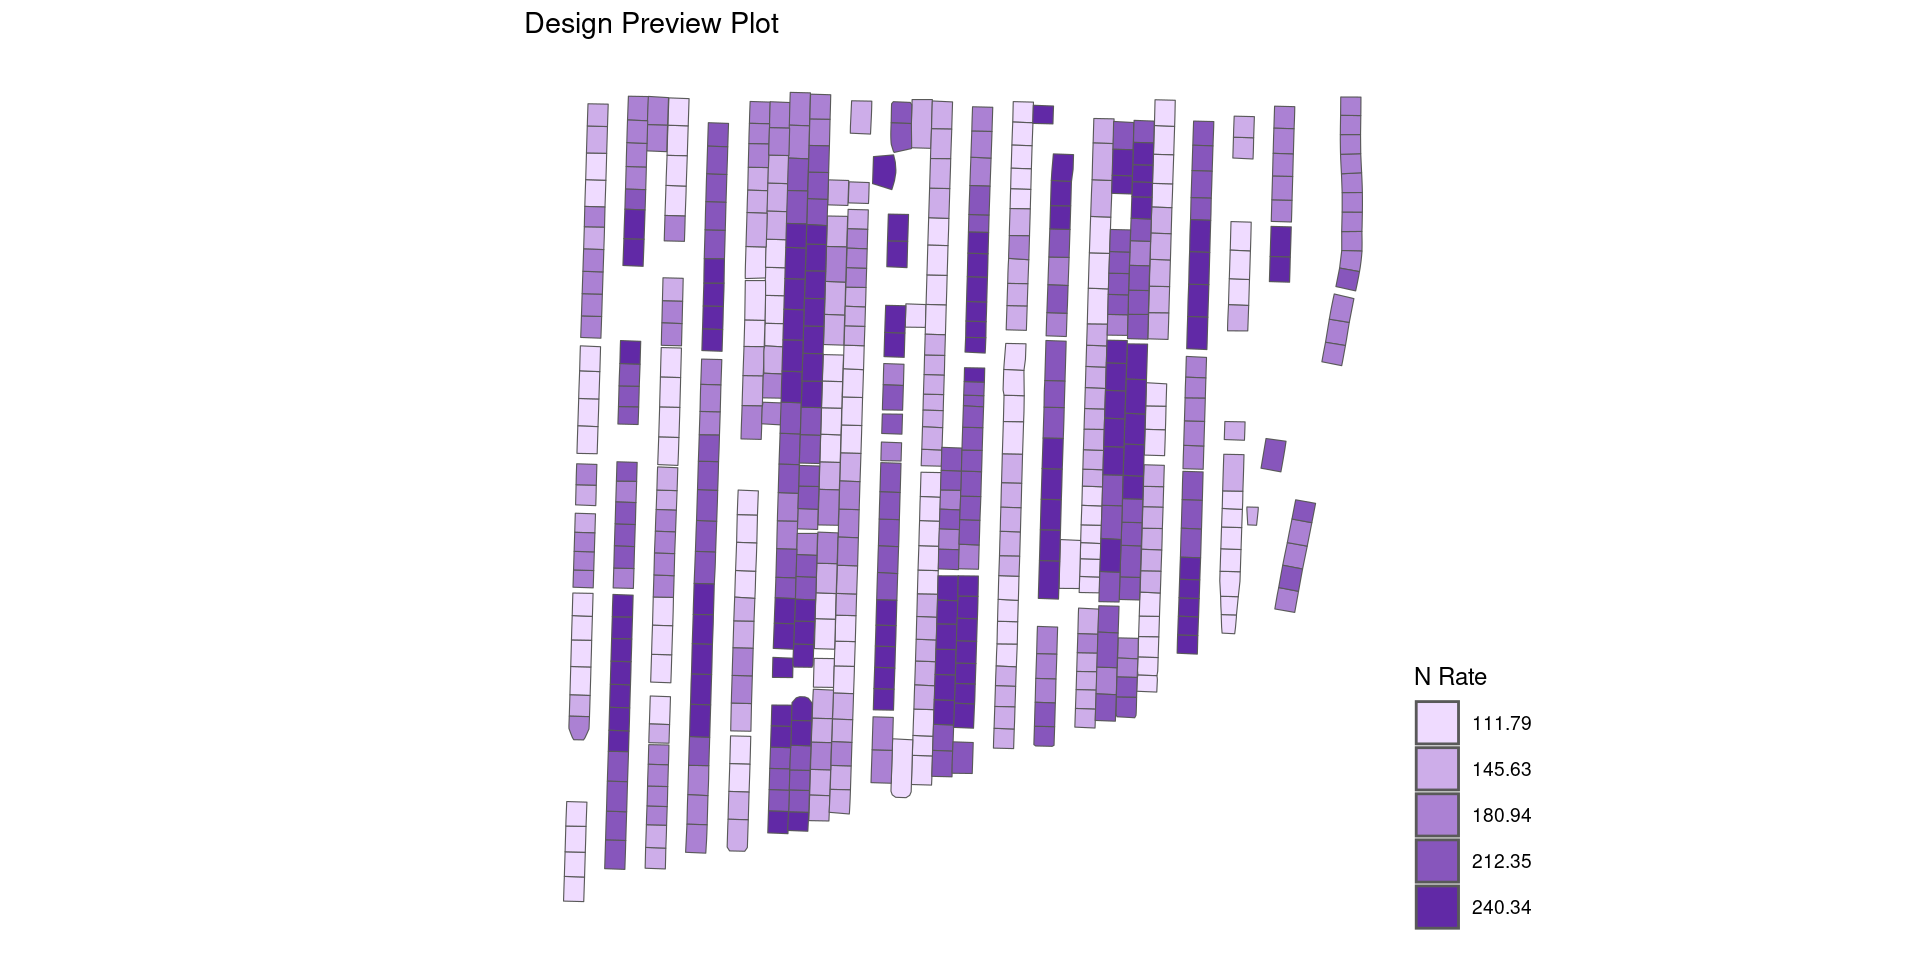
During Design:
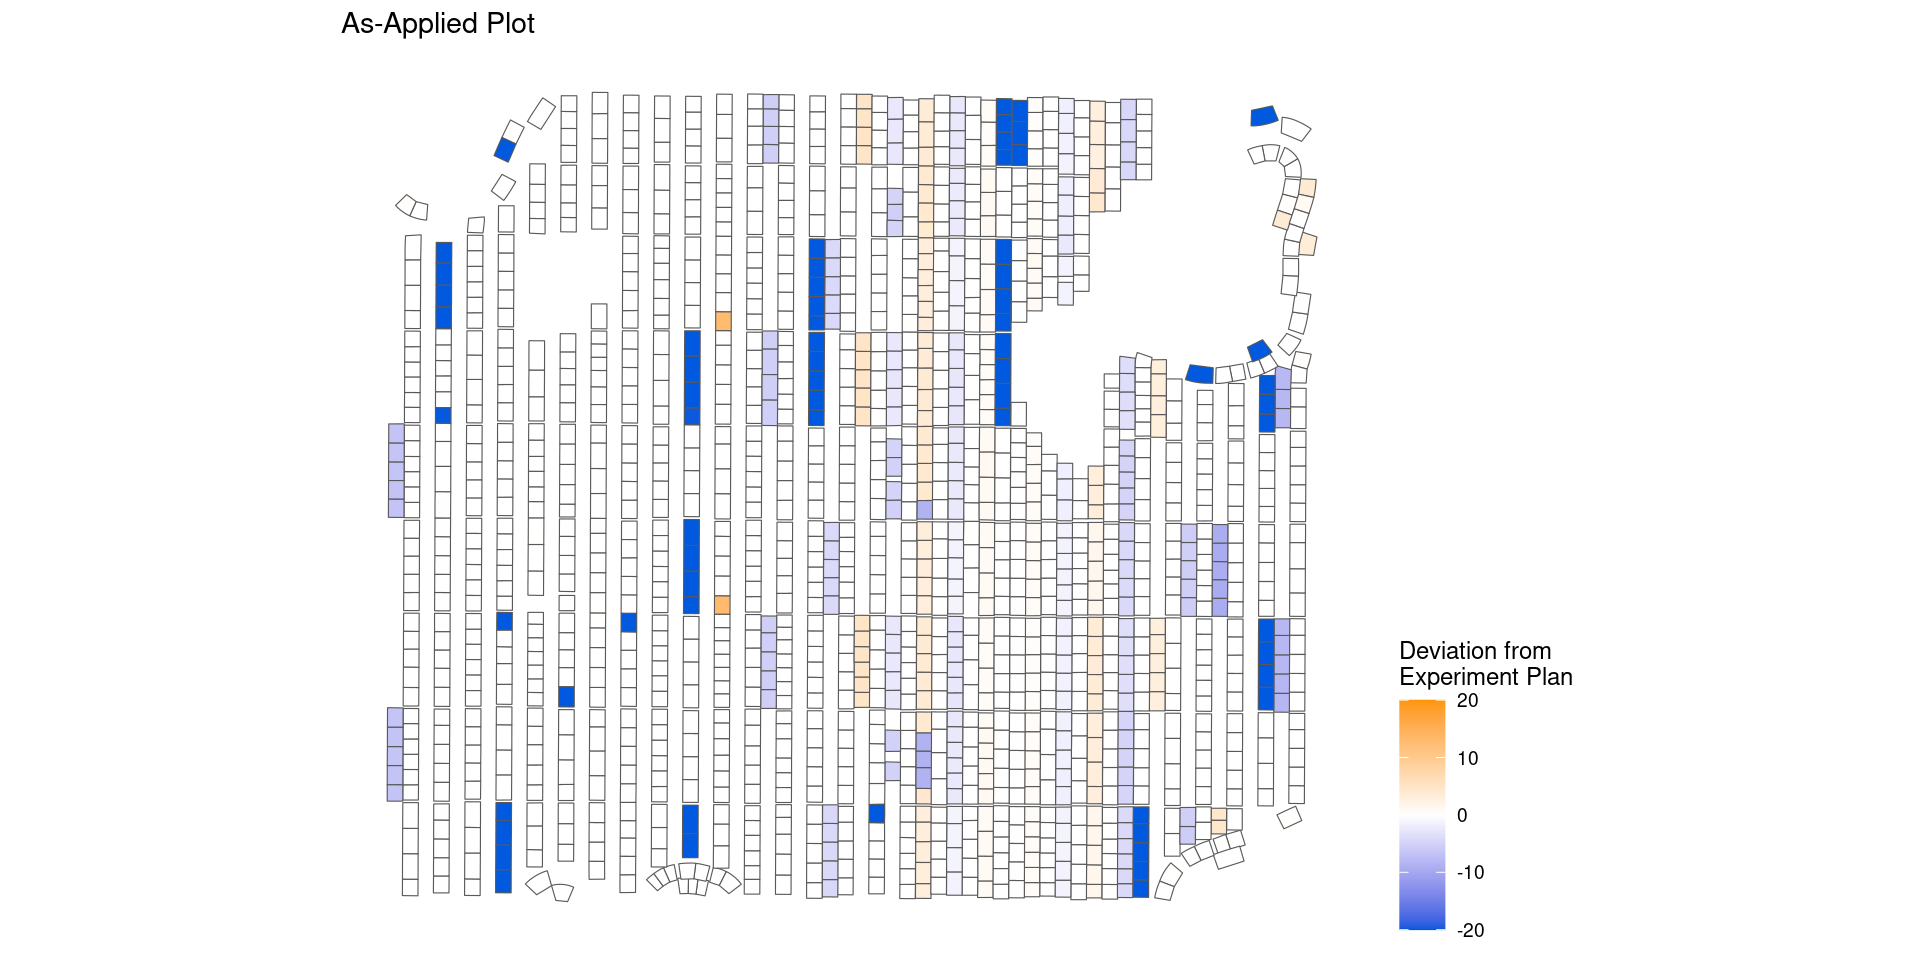
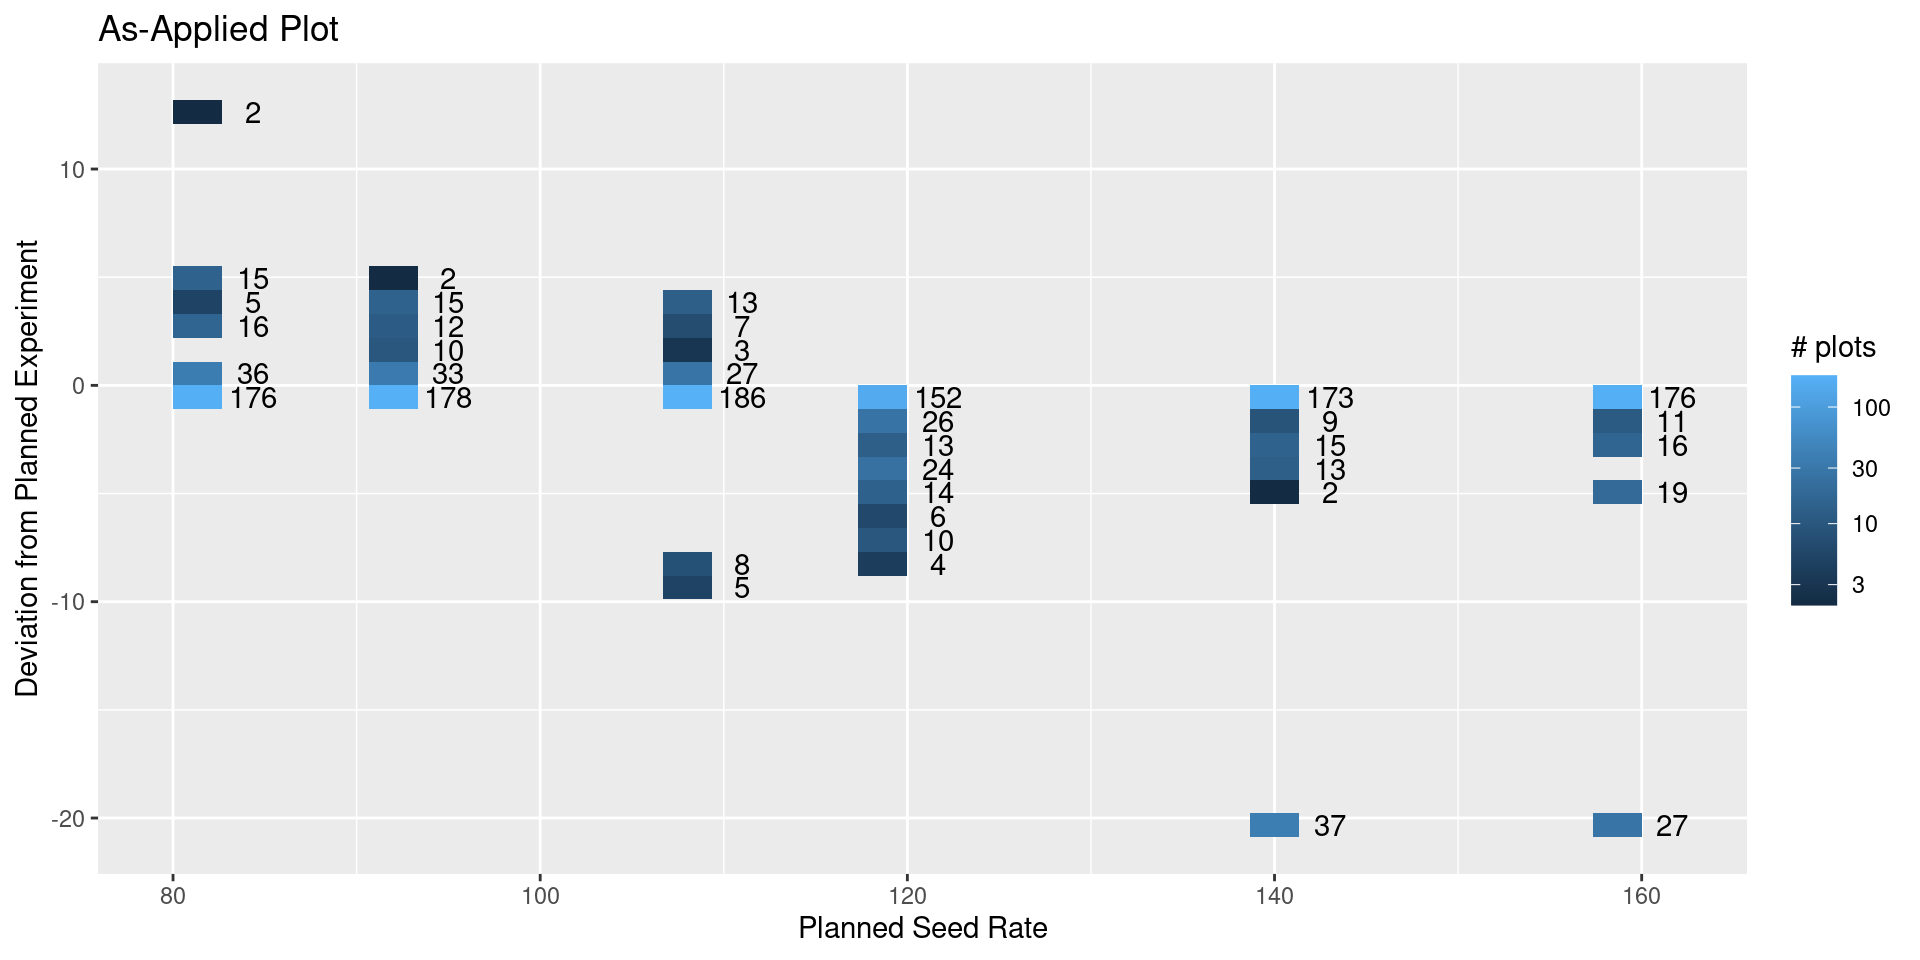
After Application:
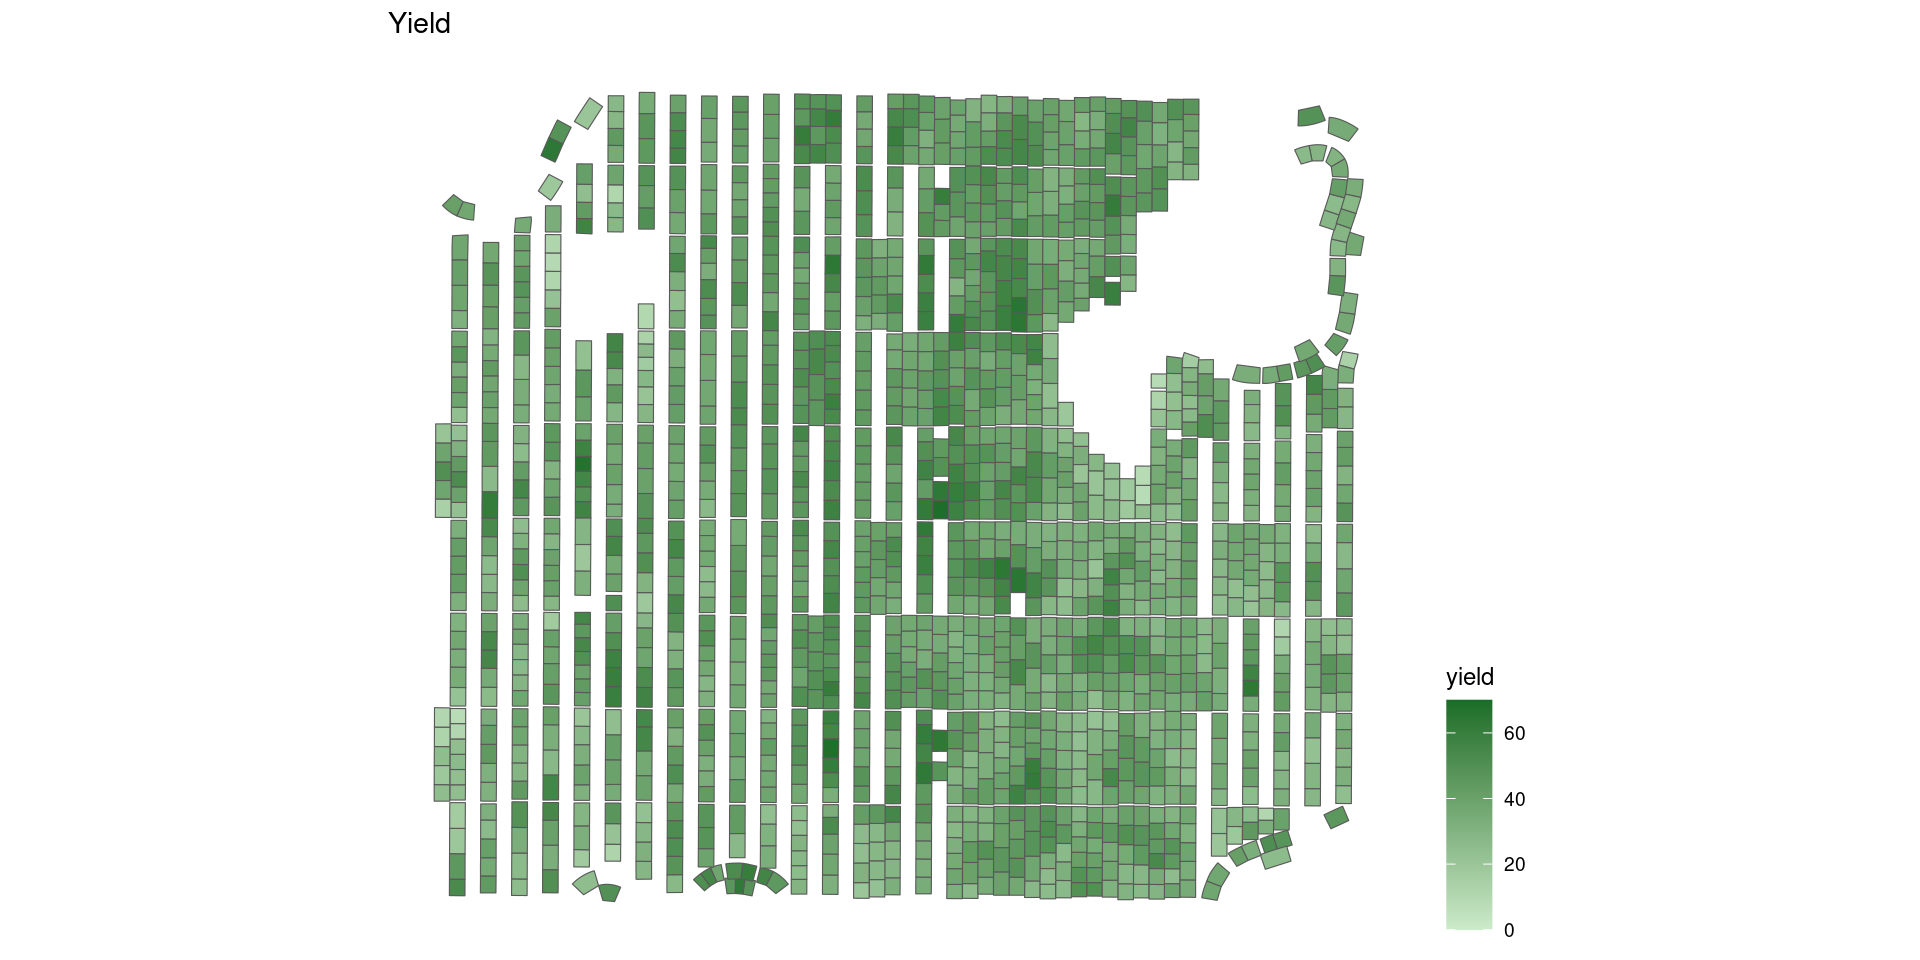
After Harvest:
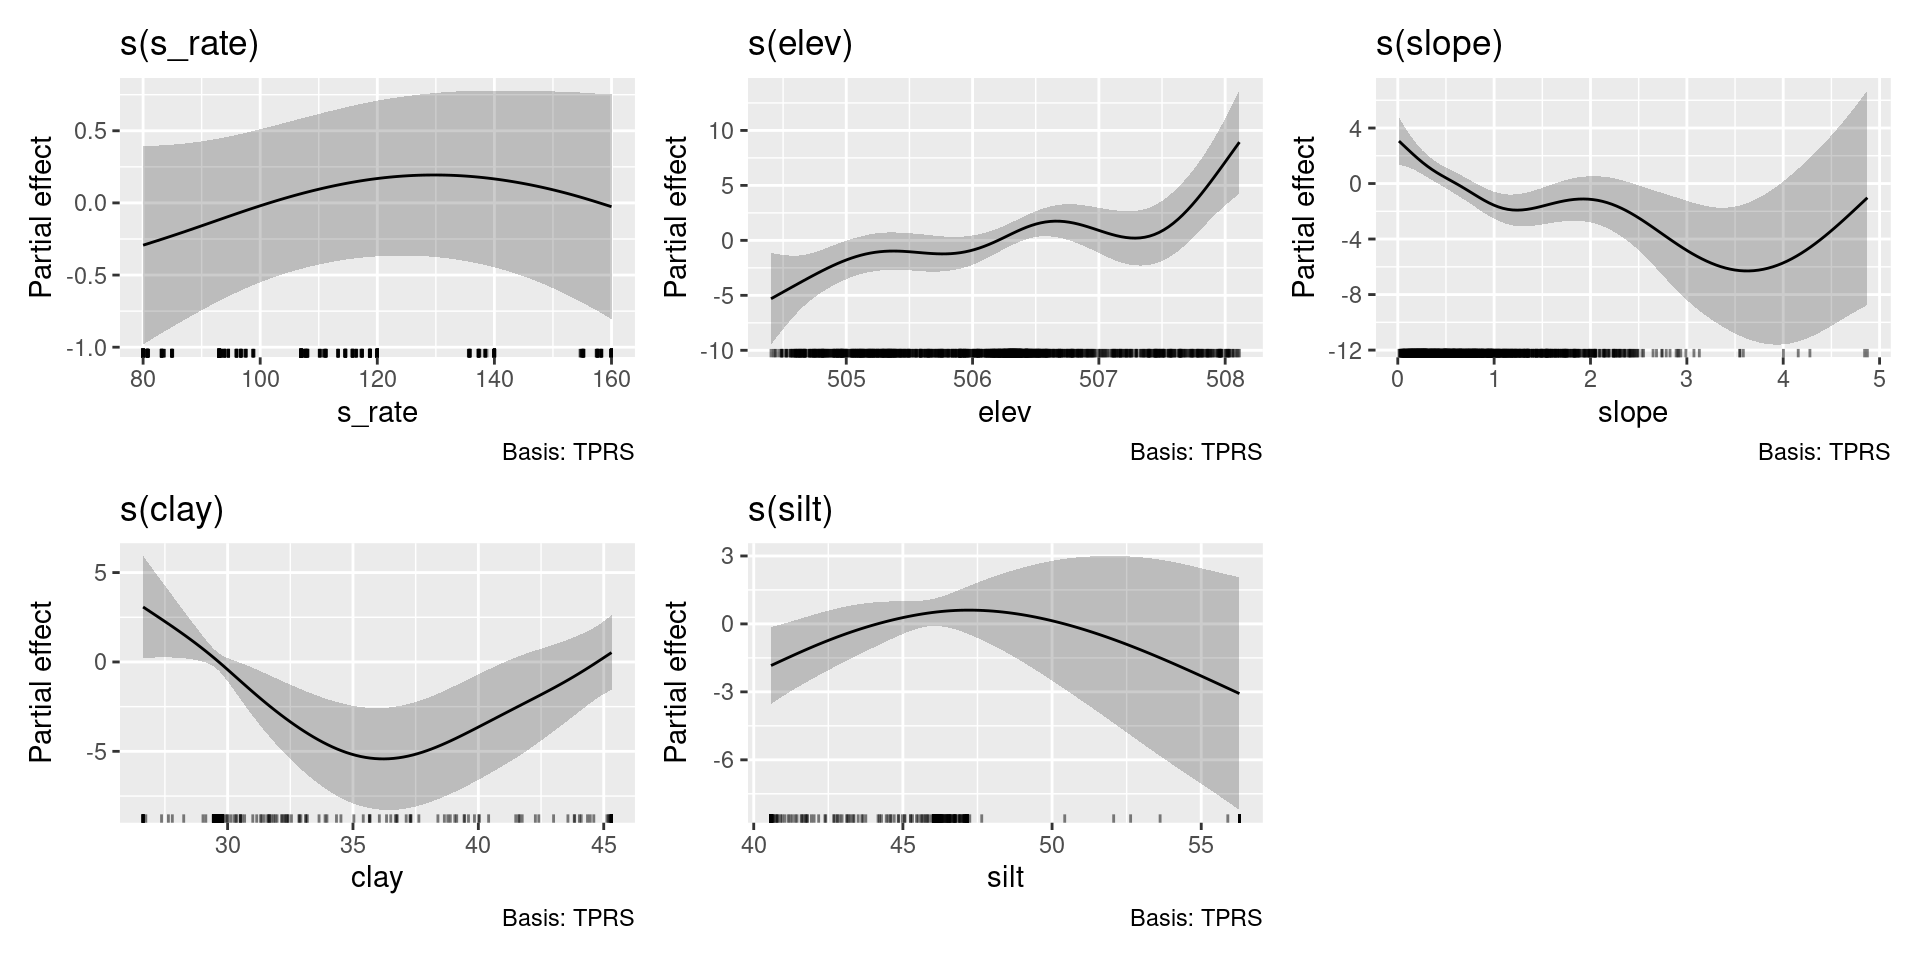
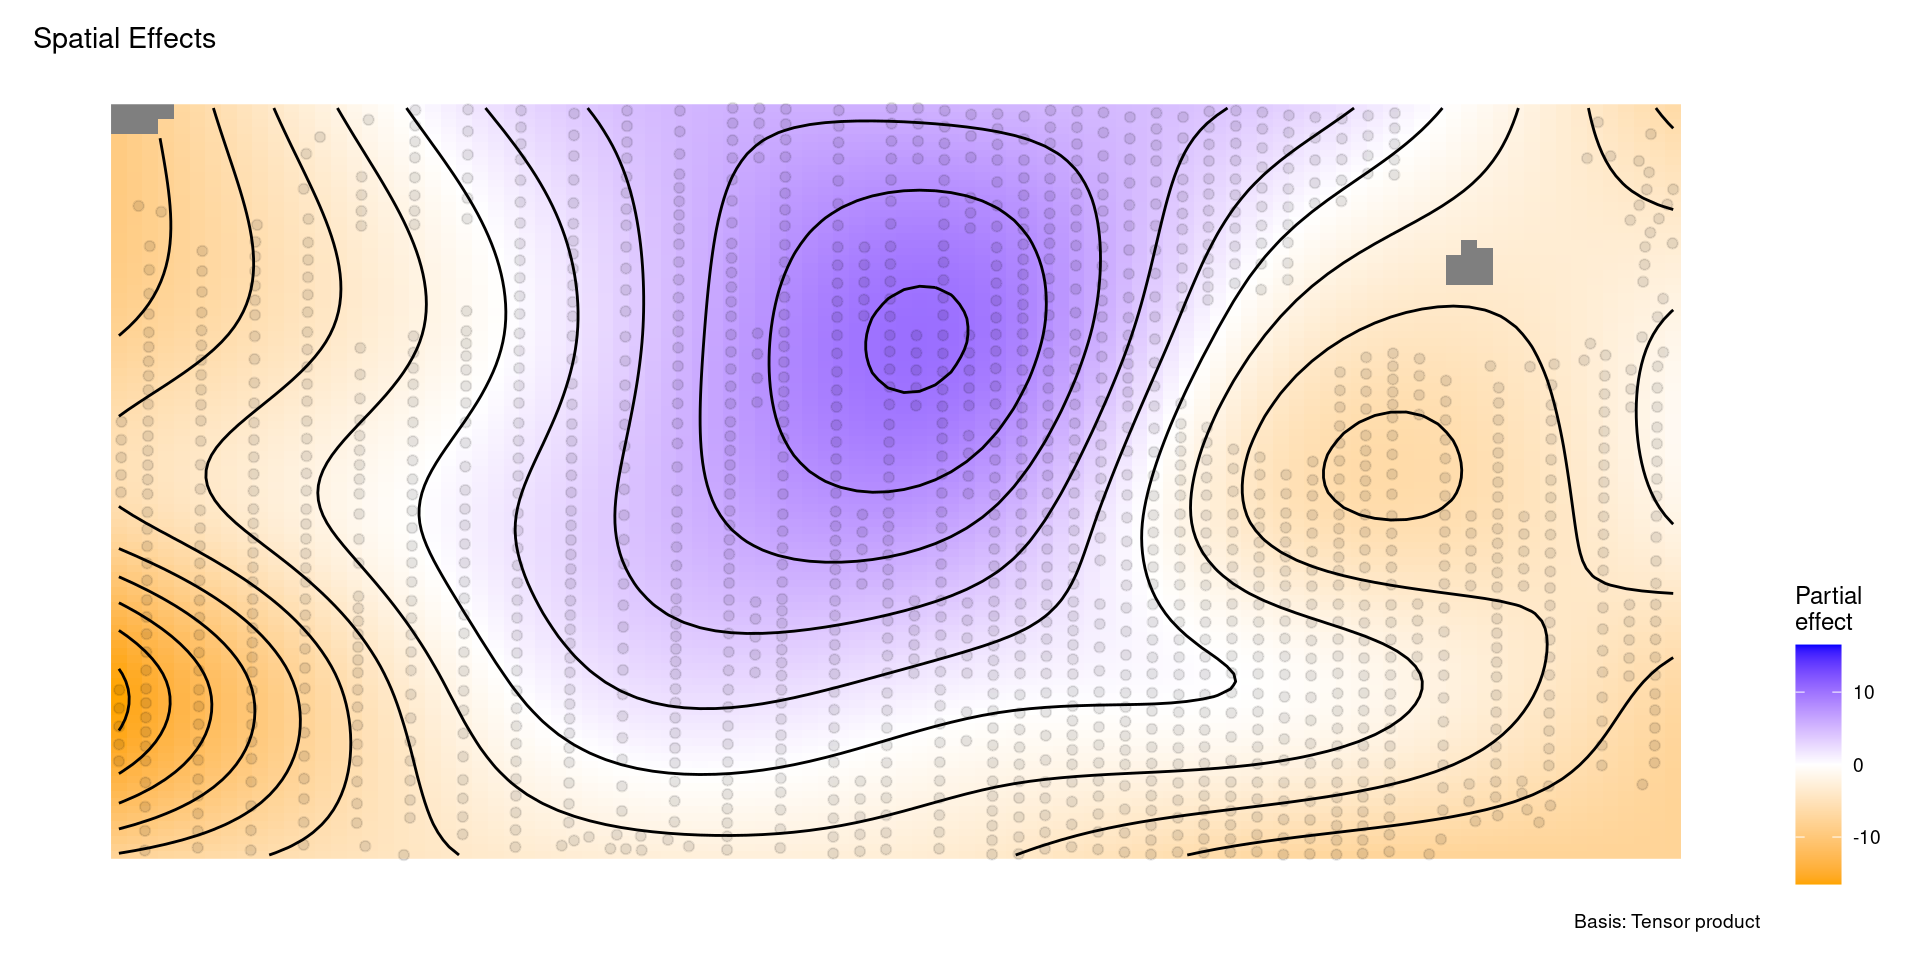
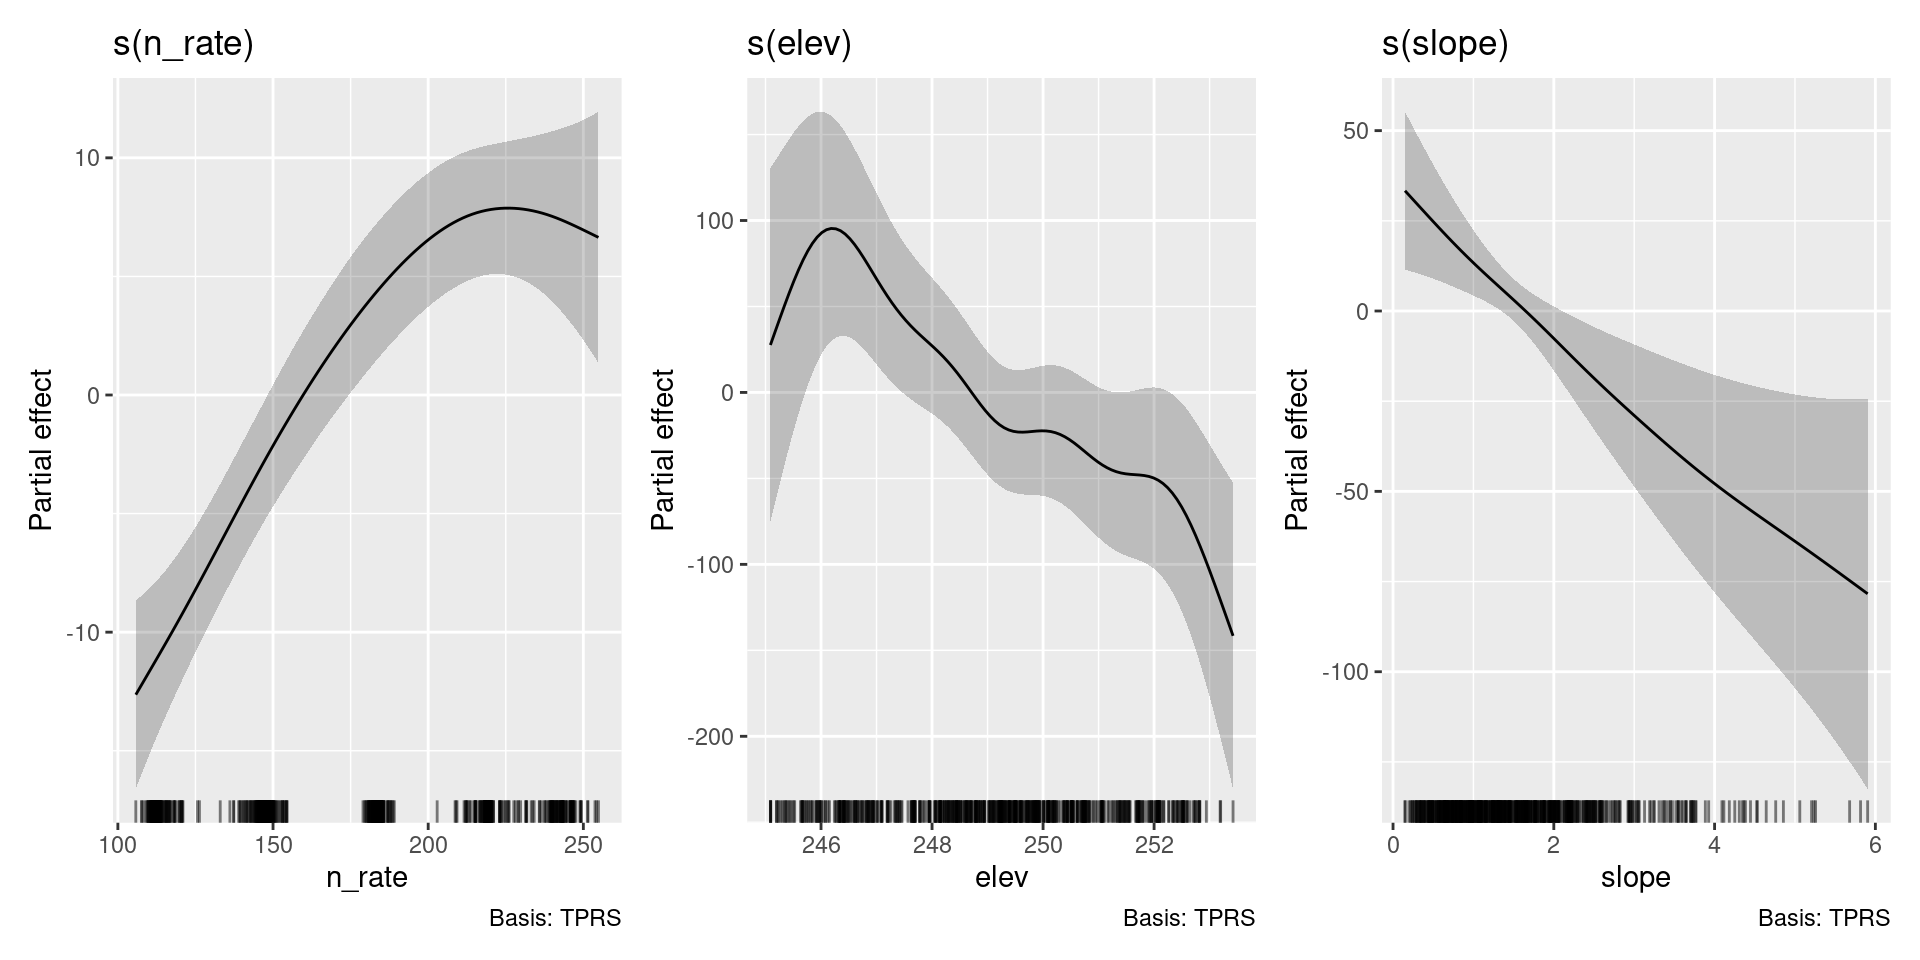
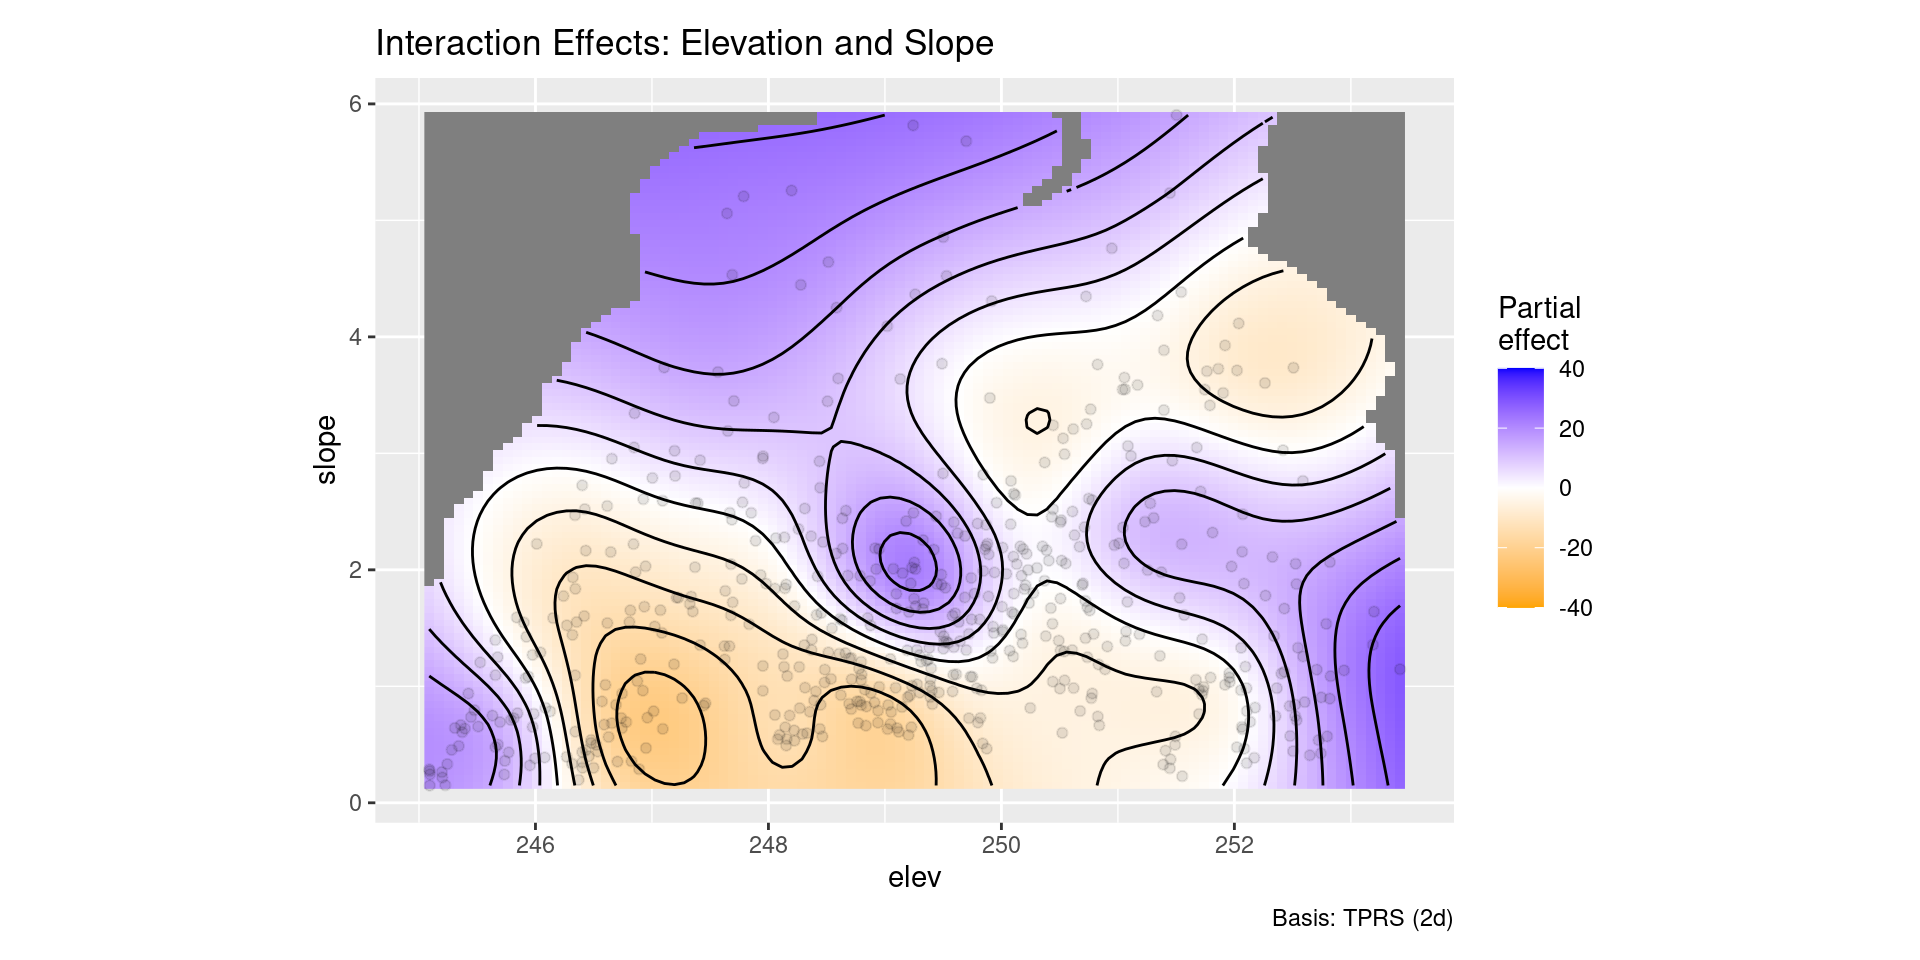
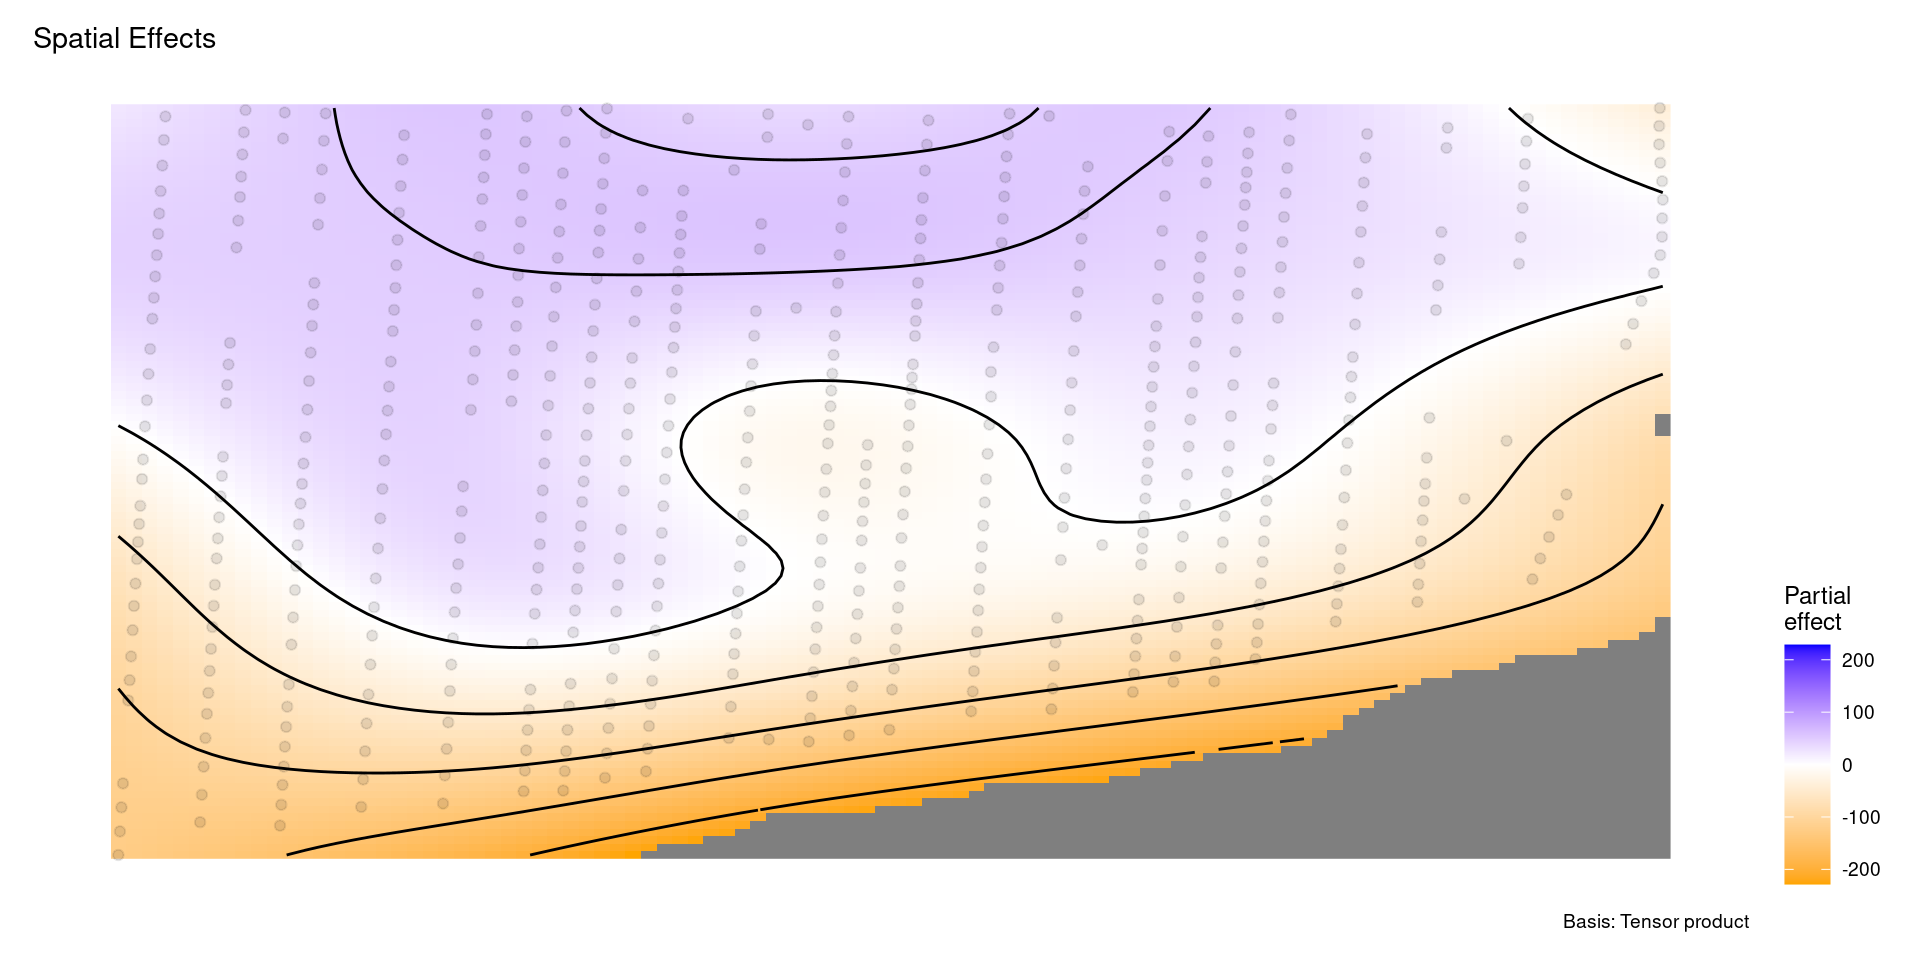
Visuals help us understand what a model is doing
Useful for identifying areas where models may be less accurate
Look at raw data vs. model results