data <- read.csv("../data/penguins.csv")
library(ggplot2)
ggplot(data, aes(x = bill_length_mm, y = bill_depth_mm, color = species)) + geom_point()
Warning: Removed 2 rows containing missing values or values outside the scale range
(`geom_point()`).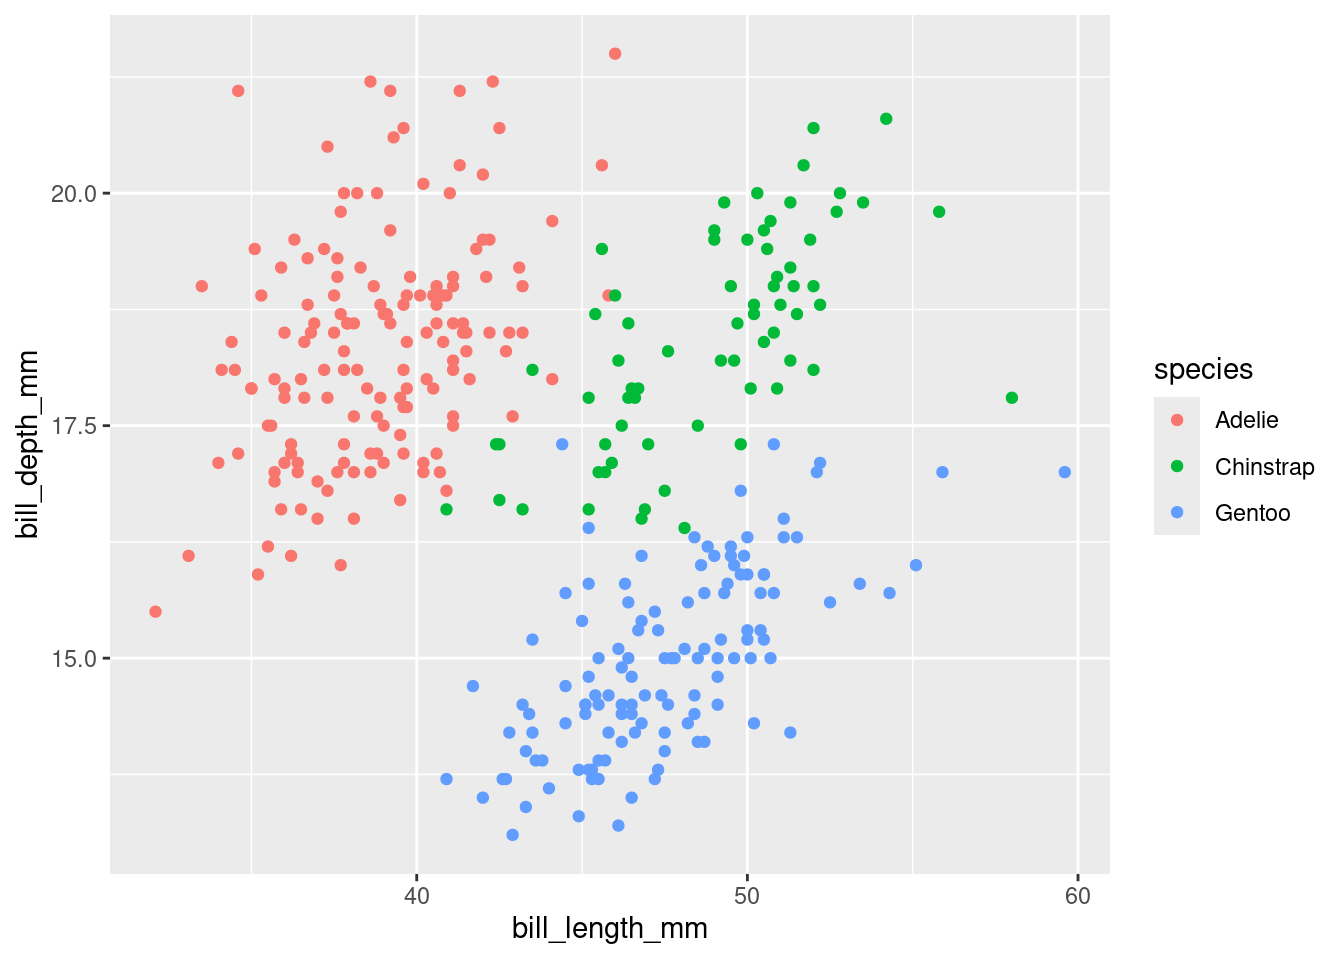
Let’s create a plot of the penguins data using ggplot2.
data <- read.csv("../data/penguins.csv")
library(ggplot2)
ggplot(data, aes(x = bill_length_mm, y = bill_depth_mm, color = species)) + geom_point()Warning: Removed 2 rows containing missing values or values outside the scale range
(`geom_point()`).