This is definitely not told in linear order from start to finish – for one thing, between Sept 11 and Dec 5, time itself lost all meaning for me. I was working about 3x harder than normal trying to do my day job (admittedly, with more turnaround time on grading than normal), support my department, do all of the service I normally do, but with more drama, and also go on the job market with all that entails. I had to ask my kids what day it was most mornings, because Saturday and Sunday were just longer writing days or days with more events I had to attend.
The Bombshell
On Sept 11, UNL’s Executive Leadership Team told the Statistics Department it was slated for elimination in a set of budget cuts totaling 27.5 million dollars. While there were a great many things that led to this “structural deficit” (see below for snark-quote explanation), ultimately, the size of the deficit was 21 million (give or take a bit) and there were 6.5 million dollars in extra cuts – coincidentally, about the same amount saved by proposing to cut 6 programs. To be very explicit, none of the academic program cuts were actually required to zero out our “structural deficit” - the necessary reductions could be accomplished with administrative cuts, voluntary retirement programs (which brought in almost 3x as much savings as expected within the UNL system), and other savings. Even as it became clear that the early retirement (VSIP) program was going to be more successful than expected, administration continued with the plan to cut academic departments in critical and/or unique fields:
- Earth and Atmospheric Sciences (including geology, meteorology, climate science – not like Nebraska needs experts in those fields, given our location in tornado alley, on top of the Ogallala aquifer)
- Educational Administration (programs to train school administrators, including the only research Ph.D. program in the state)
- Textiles, Merchandising, and Fashion Design, which trains people in quilt preservation to support the International Quilt Museum across from my office, and produces local entrepreneurs that work locally across the state,
- Statistics, which offers undergraduate programs in Statistics and Data Analytics and Data Science, a MS in Statistics, and a Ph.D. program in Statistics, in addition to providing consulting services and collaboration across the university.
- Landscape Architecture
- Community and Regional Planning - a tiny department with about 3 faculty that nonetheless provides critical planning and support services to communities across the state
To be clear, the only people in the Statistics department who had any idea that we were potentially going to be eliminated were the chair (who had been informed a few hours before the meeting by phone) and a member of the Academic Planning Committee (APC), who had worked with the Executive Leadership Team (ELT) in the run-up to the proposal being made public. Both of them had been sworn to secrecy – and I’m still astonished that the spouse of the APC member, who is also in our department, seemed to have no idea that the department was to be eliminated. Impressive adherence to the rules… more than I think I would have managed in a similar situation.
The proposed budget cuts were developed based on some interesting assumptions:
- UNL spends more than it receives in state funds (true)
- Cutting state-aided funds will improve the budget outlook (maybe)
- Income (tuition, grants) generated by departments to be cut can be retained (umm, what?)
The Chancellor’s original proposal included retaining five statistics general-education courses required within the college of ag science and natural resources (CASNR). It did not, however, seem to include any resources with which to teach those courses. The proposal claimed to eliminate 12 of the 14 FTE in the department (1 chair, 1 admin assistant, and 12 faculty), and later versions indicated that this would include 1 administrator, 1 admin assistant1, and 10-ish tenured or tenure-track faculty positions. If you can math, that leaves a single faculty member, who was to maintain the consulting program (run on graduate student labor that would no longer exist), and who would teach an estimated 20 sections of various service courses during an academic year.
It was fairly clear that the goal was to take our most popular courses which generated the most revenue, and hire adjuncts and professors of practice at low wages to teach those courses, depriving students of the chance to learn from researchers in the field (which is the big advantage of going to a large R1 university).
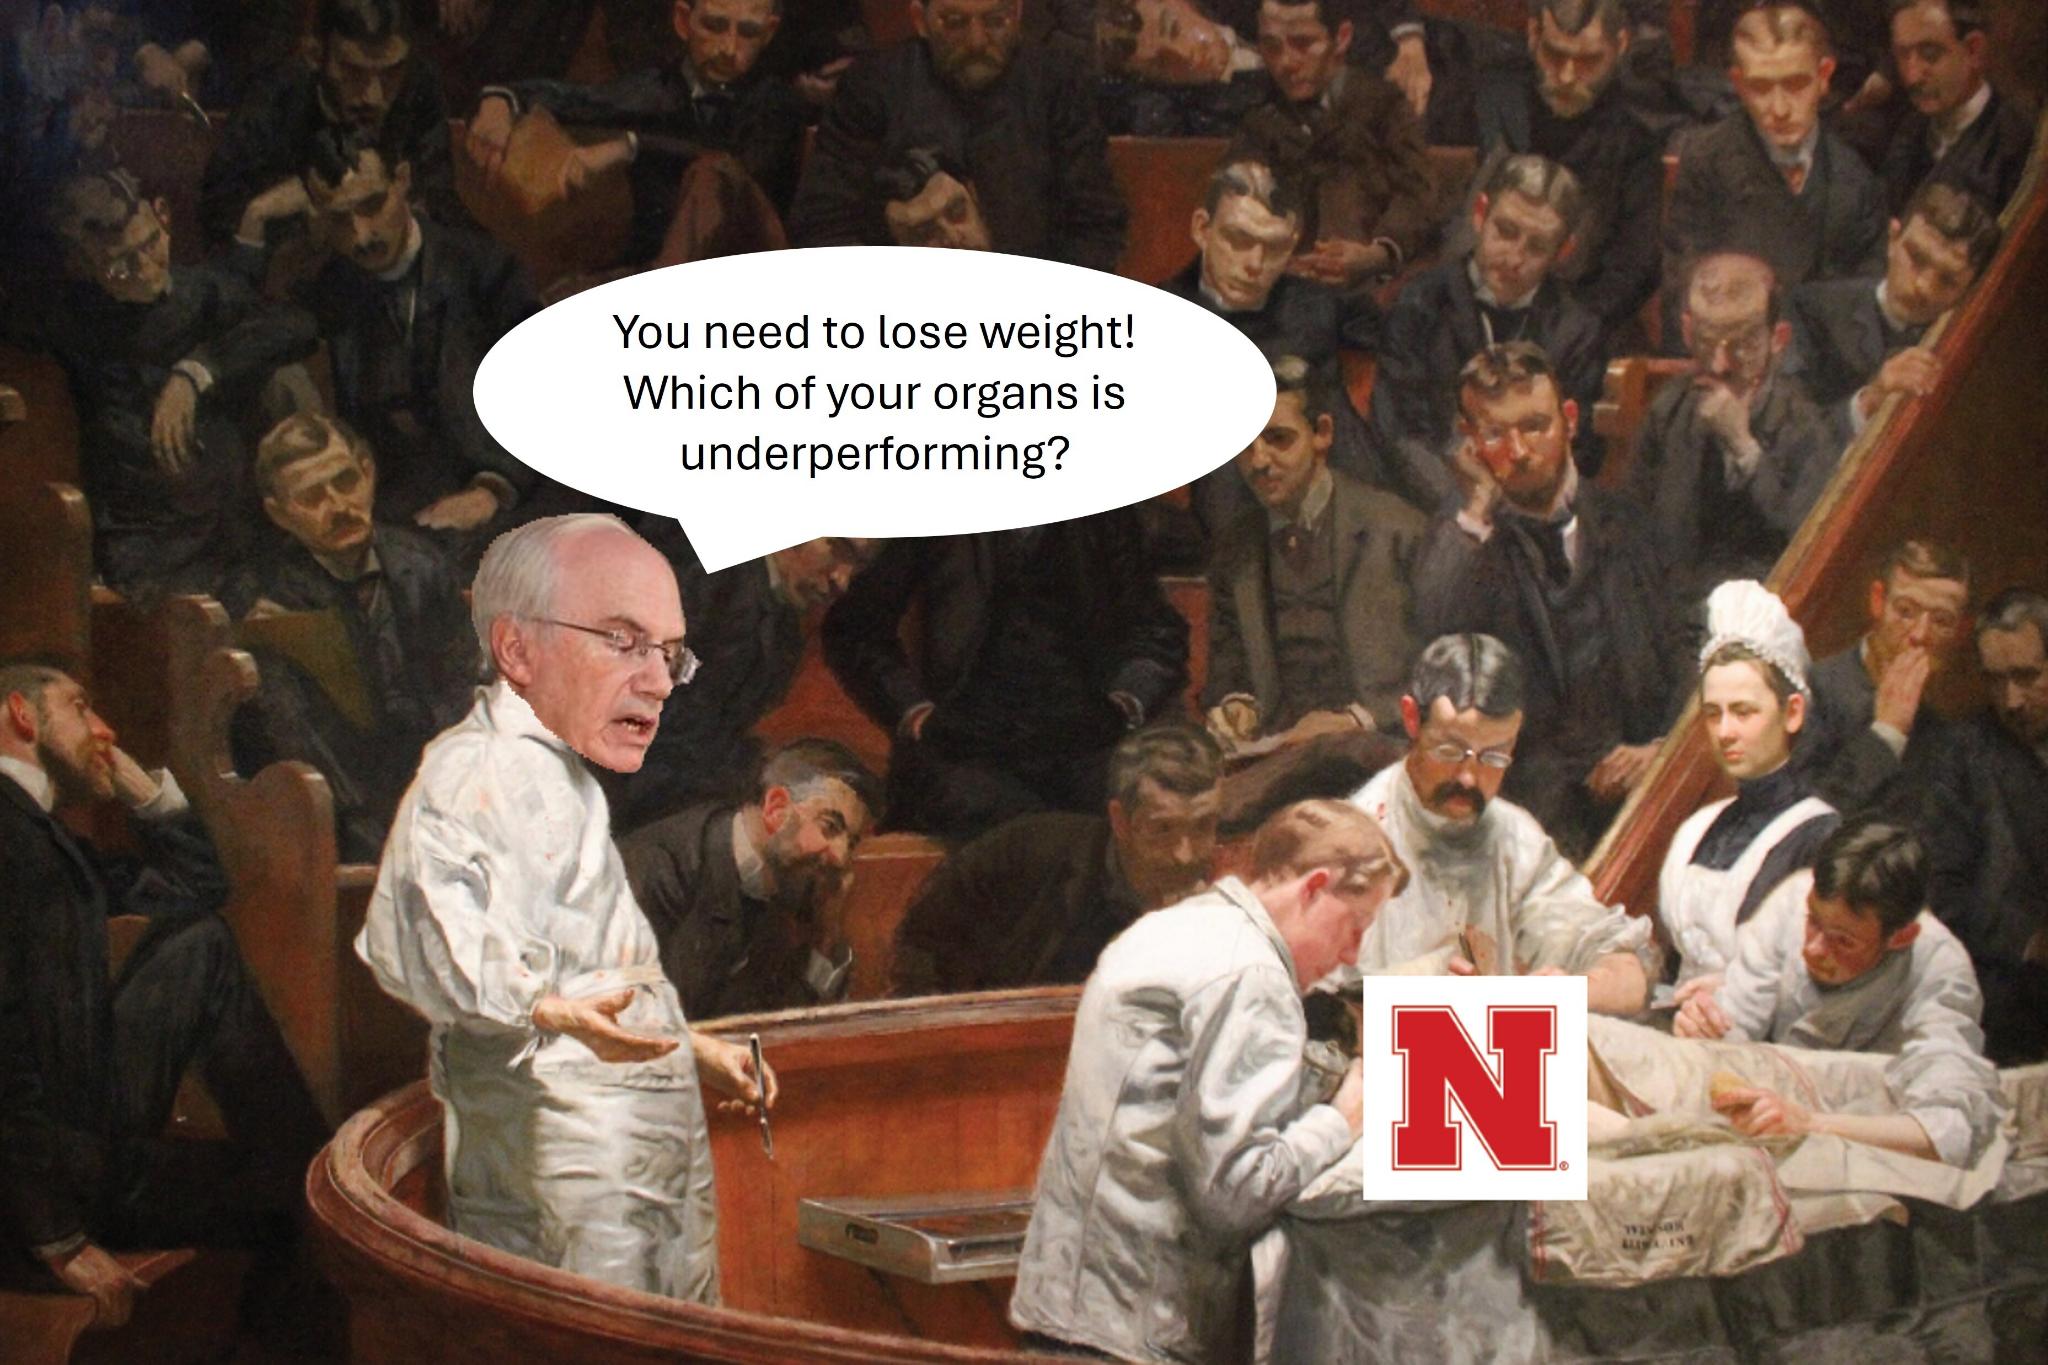
What is interesting, in all of this, is that the Statistics department at UNL made money. Even the university metrics, which were completely error-ridden in so many ways, conceded that we generated more in tuition (not even counting grants and contributions to productivity and effectiveness across the university…) than we cost in state-aided budget. In fact, our calculations determined that we generated more total value2 with only the classes that would be eliminated under the proposal than the cost of our salaries.
To drive that home: Even if you only consider courses that would be eliminated, those courses should generate about 2.1 million in tuition per year, compared to the 1.75 million in salary dollars from eliminating our positions. By making these cuts, UNL stands to lose an additional $350,000 in profit.
I’m not an accountant, but I do know that you have to consider both revenue and costs, or you’ll end up in a situation where you are cutting costs and losing even more revenue, which is a downward spiral. Unfortunately, that doesn’t seem to be easily communicated to the Board of Regents, the university president, or the executive leadership team.
The Ludicrous Budget Claims Behind the Disgraced Chancellor’s Proposed Department Cuts - The Bugeater, Nov 30, 2025
Trawling through the Data

![]()
From Sept 11 to October 10, our department worked hard to to refute the accusations of administration: that we were inefficient, did not meet research and teaching productivity standards, and strangely, that we did not meet requirements for number of graduates set by the Nebraska Coordinating Commission on PostSecondary Education3. We got ahold of a mysteriously obtained spreadsheet of the metrics used to identify poorly performing departments, along with some data documentation which gave us something to work with – were the “metrics” even accurate? What were they measuring?
It is impossible to adequately describe how much 💩 we found. Piles of 💩. Layers upon layers of 💩.
Someone at UNL clearly was entering Academic Analytics values manually by selecting the same two radio buttons for each department on campus. Most department values matched what the data documentation said had been done, but not all - they forgot to select one of those radio buttons for Statistics, which changed our “custom index” (SRI compared to the SRI values of public AAU universities) so that we were compared to both public and private AAU universities. Whoops. This is why we don’t do data entry manually - we get the data from a database directly (via download, API, etc.) and then process it with a script that’s reproducible, auditable, and makes it easy for people to understand how the data was compiled and validate those choices. Friends don’t let friends do data analysis in Excel.
In a couple of instances, the true value was something like
a.bcd, and the spreadsheet showeda.bdc– a clear indication, at least to me, that someone was manually typing values in instead of pulling the values from a database. Again, not repeatable/reproducible, not auditable, and also extremely painful for whoever was tasked with assembling the data.Several ratios of differences were defined in the data documentation…
The ratios of primary concern were defined as \[\frac{X_{t_2} - X_{t_1}}{Y_{t_2}-Y_{t_1}},\] where \(X\) was a department-level metric, \(Y\) was the university level total for that metric, and \(t_2\) and \(t_1\) were usually 2024 and 2020 respectively
Benchmarking on 2020 as baseline is not great. Did we forget the “unprecedented”-ness of that year somehow? Pandemic-related amnesia? 2020 upended everything, including higher education, and so using it to assess grant funding, student credit hours (SCH), or anything else without that contextual understanding is just… dumb. Not all departments or disciplines were affected by the pandemic equally, and no information was provided about how e.g. SCH calculation was affected by the pandemic.
Under normal, stable circumstances4, we would expect that observations of \(X\) (and \(Y\)) over time would be drawn from distributions that are correlated in time (2021’s value will be closer to 2020 and 2022 than to 2025) and have about the same overall mean – there is a finite and relatively stable pool of grant money or students credit hours that any department can compete for, because there are a relatively similar number of students from year to year, and a relatively similar number of faculty members from year to year within a department who can compete for grants and teach classes. That is, these numbers are affected by both supply (faculty, grant funding) and demand (students, faculty), which tend to be similar from year to year. We generally hope for an increasing trend (which is what these types of metrics are designed around), but obviously there is some temporal variation as well. Unfortunately, if there isn’t a year-over-year increase, the numerator and denominator would both be expected to be 0, statistically speaking.
As any Algebra 2 or Calculus student knows, \(\frac{0}{0}\) is undefined. Statistically, we worry about ratio distributions and specifically about having an expected value of 0 in the denominator. If the numerator and denominator are both normal distributions and the denominator has mean 0, then we have a Cauchy distribution, but even if the numerator and denominator aren’t normally distributed, it’s still a rather big problem to have a mean of 0 in the denominator… a problem that results in an undefined theoretical mean, infinite variance, and a good counter-example for proving theorems5. Subtracting similarly distributed things is a really great way to get a mean of 0 in both places. Hilariously, the administration then standardized these values, subtracting the empirically-calculated mean and dividing all values by the empirically calculated standard deviation. Statistically, I’m pretty confident in saying that standardizing a Cauchy (or similarly complicated) random variable destroys all of the information present in that variable – basically, you’re f*d6.
Defining a ratio like this and assuming it will be a percentage value doesn’t really work – because % change per department can be negative, there is no guarantee the result is bounded, even though a bean-counter in administration with a background in sports analytics or clinical psychology might make that assumption. As a result, you end up with values like -24093.3 that don’t have an obvious interpretation.
Especially for total grants awarded ($), this is a bad metric – there’s too much year-to-year variation in awards within a single department. I had pretty minimal awards in 2020 (because I had just gotten to UNL and grants take time to transfer) but I wrote a ton of proposals during lockdown and got funding for more of them than I expected. As a result, I had more funding than I could use in 21, 22, and 23 – well over 1.5 million in total – because I couldn’t recruit enough graduate students when the economy was booming. By 2024, my existing grant funding had died down and I was writing proposals again, including a successful CAREER award that I found out about on July 28, 2025 but wasn’t counted in any of these metrics. In a big department, this probably averages out, as each faculty member is on a different cycle, but in a small department that doesn’t have a huge pool of available grants to apply for (Stat grants are usually pretty small, since we don’t really need equipment and lab space and animals/chemicals), there is a ton of variability in grant funding. While all departments may have been treated the same, the method of assessing “growth” in research funding in particular is really just not effective.
I chronicled a lot of the issues I found, focusing on UNL’s analysis of internal data, while Heike worked on UNL’s analysis of Academic Analytics data, which was equally f’d. Heike found, for instance, that the Textiles, Merchandising, and Fashion department was utterly screwed by the Academic Analytics metrics because someone at UNL had decided that they were ‘Consumer and Human Sciences, various’ instead of ‘Textile Science’, ‘Apparel and Textile Manufacture’, or any one of a number of other more appropriate CIP codes for classifying departments7. This was an egregious error – but not one that the university administration acknowledged or changed.
At the risk of this sounding like a humble brag, this entire analysis of the metrics and data and associated BS led to what was, at that point, the weirdest moment in my life. I was late to a meeting of faculty affected by the cuts, having just met with some of the people who put the metrics together to tell them what they screwed up. Heike and I had hoped to sneak in and sit in the back and not disturb things, and when we walked in, someone introduced us (interrupting what they were talking about) and people … clapped? I’m used to seeing “and everyone clapped” as a reply to an internet story that is clearly BS, but while it wasn’t everyone, there was clapping and it was weird. At any rate, the Statistics department generated a lot of goodwill around campus exposing these metrics, explaining why they were BS, and in some cases, suggesting how they could be gamed in the future when they reared their ugly heads at the next inevitable set of cuts. Goodheart’s Law in action.
Meanwhile, the department coordinated a letter-writing campaign that produced an absolutely magnificent amount of letters from all over the globe talking about the importance of statistics, the reputation of the department (small but high-quality, punching above its weight class, an innovative an enviable undergraduate program). In the APC report, I quoted liberally from these letters, and reading them was one bright light in an otherwise agonizing period of stress, self-doubt, and despair. I saved several of these letters and emails to read later.
At some point in September, our chair met with Dr. Tiffany Heng-Moss, the vice chancellor of the Institute of Agriculture and Natural Resources at UNL8, and was told that Statistics did not contribute to the mission of IANR and was not in alignment with the goals of IANR or UNL (this is a rough paraphrase of what he remembers from the meeting, since obviously this was an astounding statement). Reading the email summarizing this meeting, I hit the first pit of despair during this process – if our administrators truly didn’t see that Statistics (and consequently, the department of Statistics) was essential for a land-grant, flagship, R1 university, then maybe there wasn’t any hope of saving our department.
Faculty members spoke at the Board of Regents meeting on October 3, emphasizing that the cuts were based on bad data, bad analyses, and thus would lead to bad decisions that would hurt the university. My comments were published on The Bugeater, the UNL AAUP chapter’s blog.
Radicalizing Introverts
We tried to bring our concerns to the Executive Leadership Team that were the architects of the cuts, hoping to spare the university the damage and embarrassment of cutting a Statistics department using faulty statistics. As a member of the Faculty Senate Executive Committee that meets weekly during the semester, I used each meeting with various administrators to raise the issues with the metrics and the process used to identify departments to eliminate. While we started out trying to work with the ELT and upper administration to address the data flaws (some of this outreach is documented in the report), we were met with additional gaslighting and obfuscation that convinced us that we should put our efforts elsewhere.
I don’t think I’d ever talked to a reporter on the record before September 12. I have nothing against reporters – most of the time, they do good work, even if sometimes their charts and graphs could use … improvement. Throughout this entire process, I’ve whined to friends and family alike that I just want to go back to my basement office and do statistics and draw charts, and instead I’m talking to reporters and organizing rallies and demonstrations. It reminds me of one of the signs I’ve seen from various protests - “So bad that the introverts are here”.
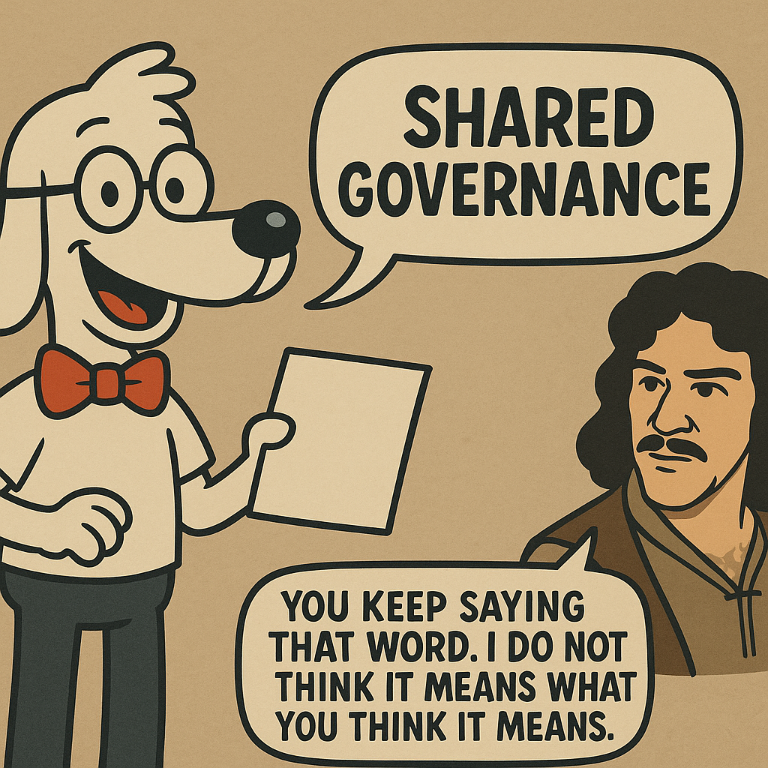
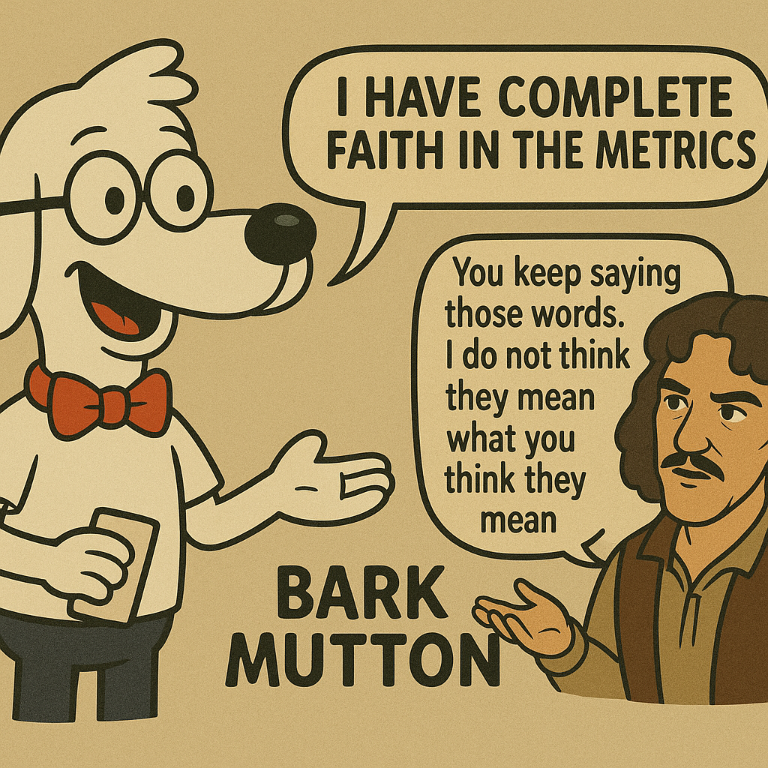
When you think of hotbeds of radicalism or activism or … anything… on campuses, the Statistics department is probably not the first suspect, or even the 50th. Philosophy, English, Sociology, Education, and Gender Studies - absolutely. Librarians are also a subversive bunch, making knowledge available to everyone for free and helping people sort out fact from fiction. Not to pick on my liberal arts and humanities friends, but the popular assumption is that these departments are hotbeds of activism, and some of the friends I’ve made at UNL bear that out9. Political Science might have a few suspects, too, including a former Arts and Sciences Dean who studied participatory democracy, but is clearly hopeless at anything quantitative. He has an alter-ego named Bark Mutton (Figure 2) that featured in some excellent stress-relieving memes. Biology/Agronomy/Natural Resources probably have a some people who are passionate about climate change, recycling, and that sort of thing. The point being, it takes some work to get statisticians riled up about almost anything, as a group - we have our internal R vs. Python, Bayes vs. Frequentist academic debates, and the ever-present Theory vs. Applied battles found in almost every academic field.
However, when you threaten to cut a Statistics department based on bad data and bad analysis methods, and it’s SO bad that you just. keep. finding. new. 💩… statisticians can get pretty worked up. I found myself raising my voice at innocent colleagues in meetings trying to explain just how bad dividing by zero (statistically speaking) is, and coming up with new metaphors for how badly these metrics were used (averaging numbers in the phone book, comparing apples and oranges to kittens, and so on). Colleagues I’d thought were incurable introverts and completely passive were willing to discuss walkouts and showed up to protests. You can make a radical out of an introvert with enough systematic injustice that involves misusing the thing they care about.
All of this is to say, for any future employers, potential collaborators, or colleagues… I’m generally well behaved and professional, with a decent helping of snark and lateral thinking when the situation calls for it. My cardinal rule is that I won’t say anything behind your back if I wouldn’t say it to your face or if I haven’t addressed the situation with you before escalating it up the chain, and I tried to adhere to that rule during this whole process, up until it became clear that I was wasting my time trying to shout at a bureaucratic brick wall, claims of shared governance be damned.
I started talking with Emily Wolf from the Flatwater Free Press and Justin Diep from the Daily Nebraskan, UNL’s student newspaper, hoping to bring the metrics and the implications – that UNL was cutting critical departments, including Statistics, based on bad math – to the general public.
APC Hearings
To prepare for the Academic Program Committee (APC) hearings, and to support other departments in their arguments about the metrics, I compiled a report for our department’s presentation to the Academic Program Committee that included Heike Hofmann’s forensic analysis of the university’s use of Academic Analytics data, Erin Blankenship’s expertise in undergraduate and graduate courses and program enrollment, and a lot of conversations with Chris Bilder, Sanjay Chowdhury, Bertrand Clarke, and Kent Eskridge, among others. Our main argument wasn’t that the data and the analysis were wrong (though they were), but that Statistics is an essential department at any R1 land-grant university, and that the department itself was healthy and growing – the metrics reflected a period in which we were preparing to start a new program and putting a lot of investment into gains in students, enrollment, and economic impact on the state that will only be realized starting this year when our first undergraduate cohort graduates. However, some of the flaws in the data and analysis were addressed point-by-point in the appendices to the report, with a target audience of people familiar with statistics.
The APC hearings were held during the first 2 weeks of October; Statistics and Earth & Atmospheric Science were held on the final day, October 10th. The hour long presentation featured the accusations made against our department, and we were given a chance to respond. The Chairs of the UNL Mathematics and Agronomy departments spoke in our defense, along with talented graduate and undergraduate students who made the case for how important our department and programs were to their lives and careers.
Waiting, waiting…
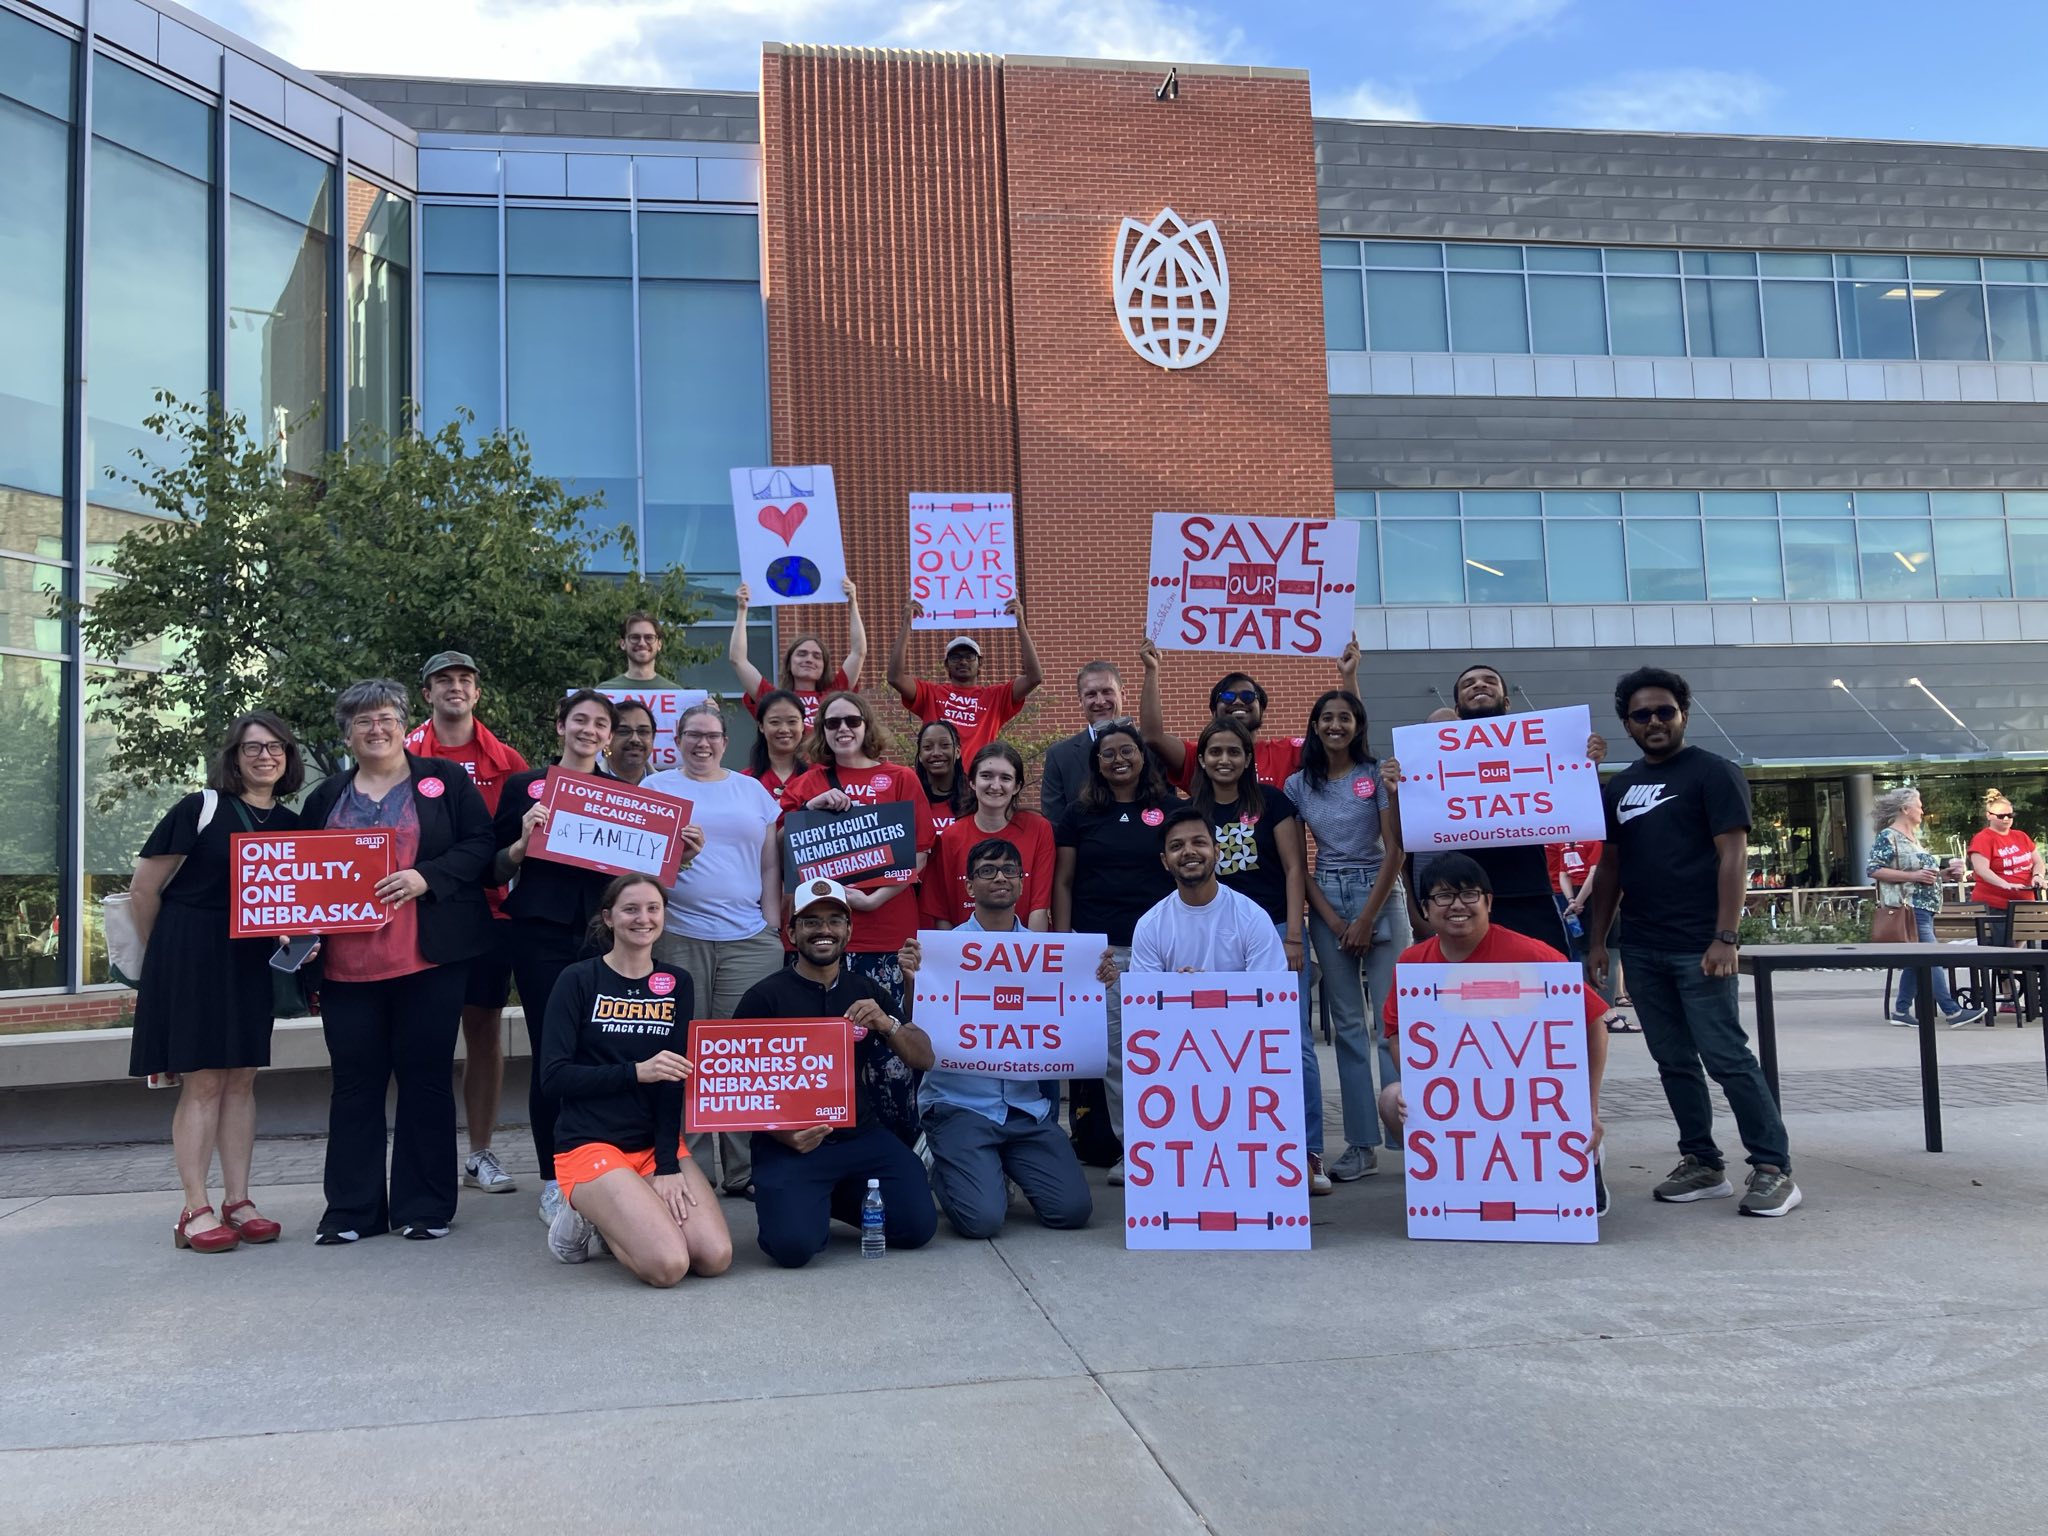
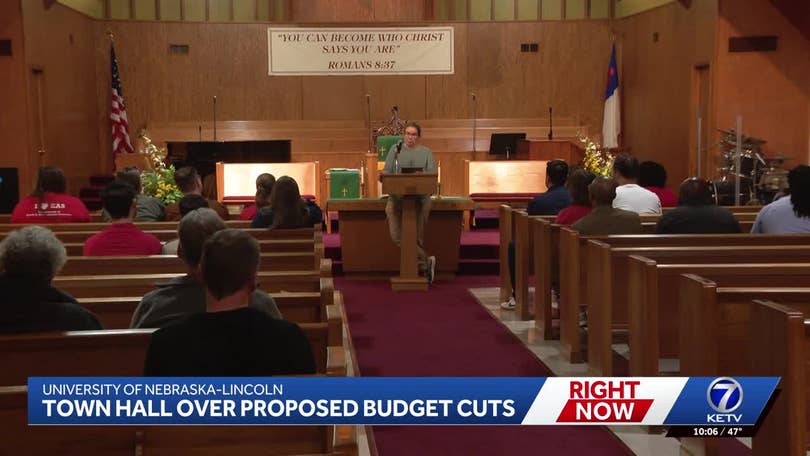
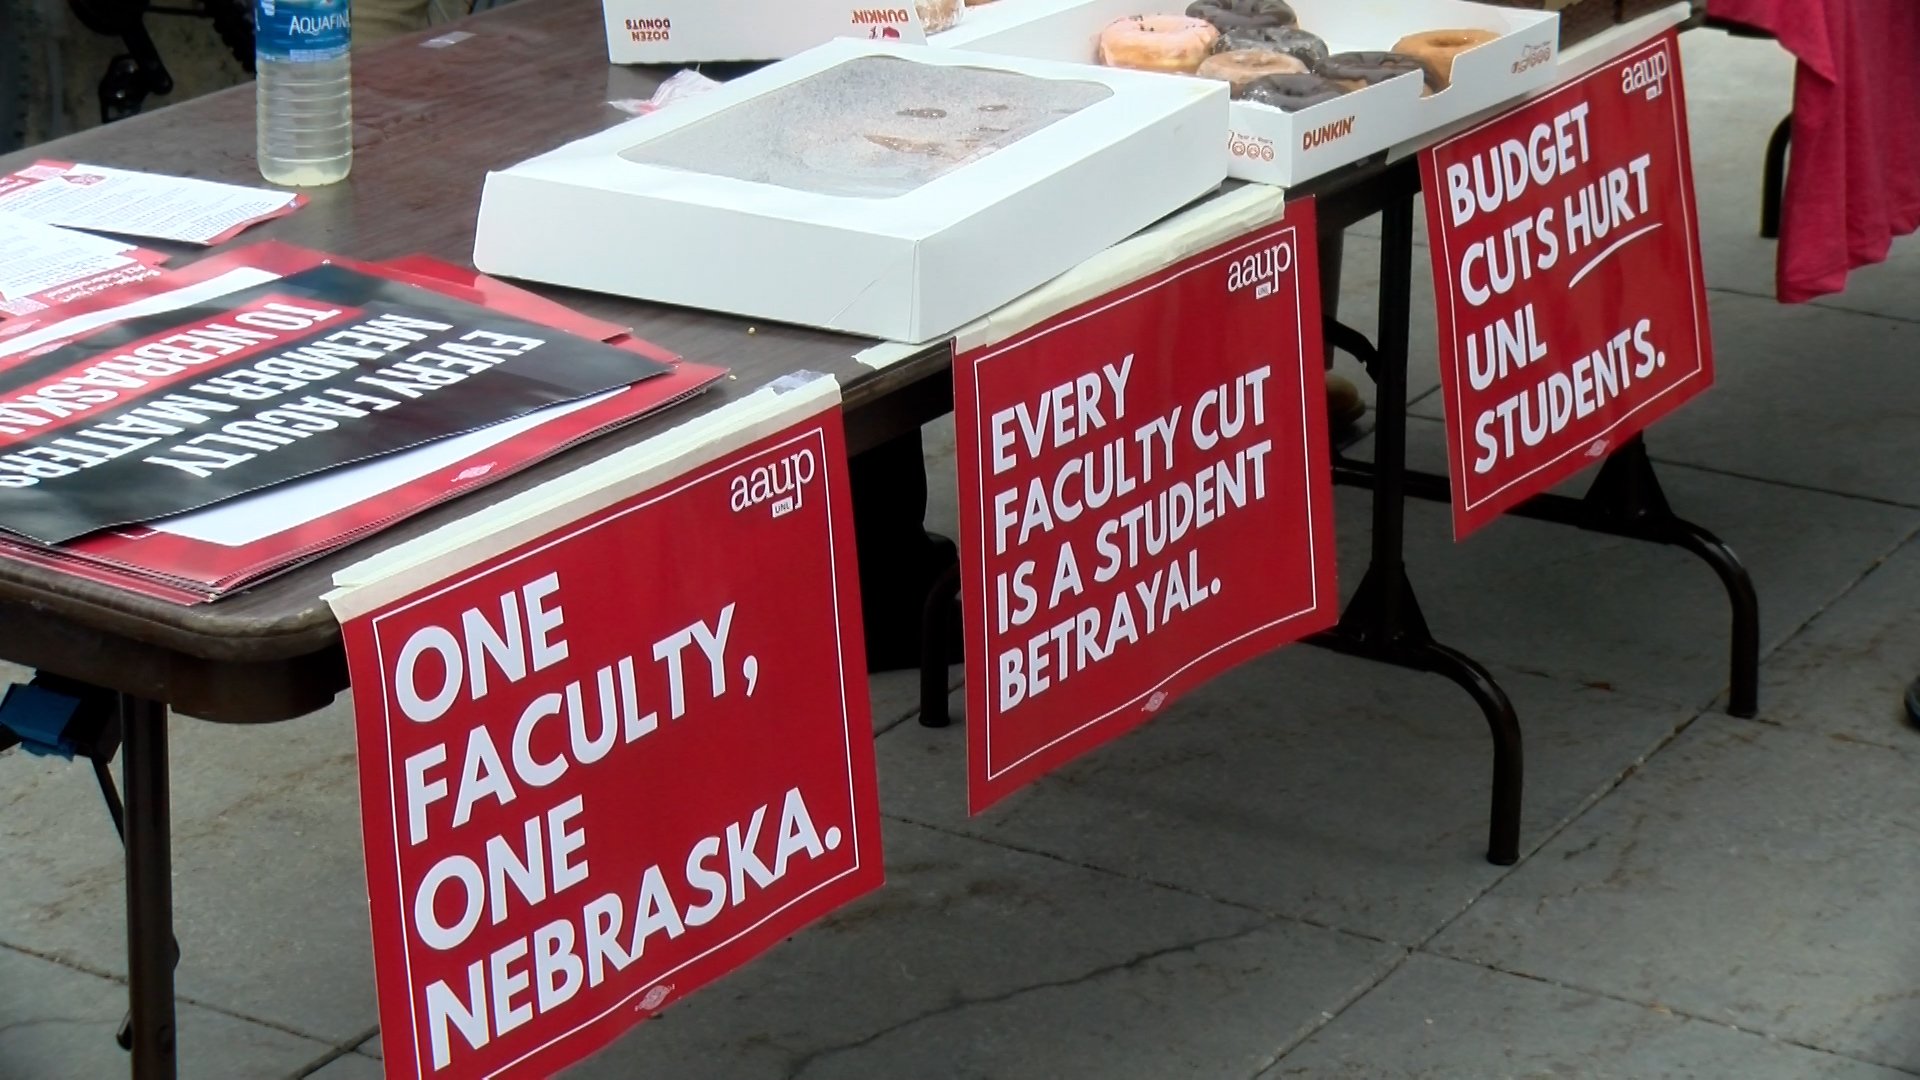
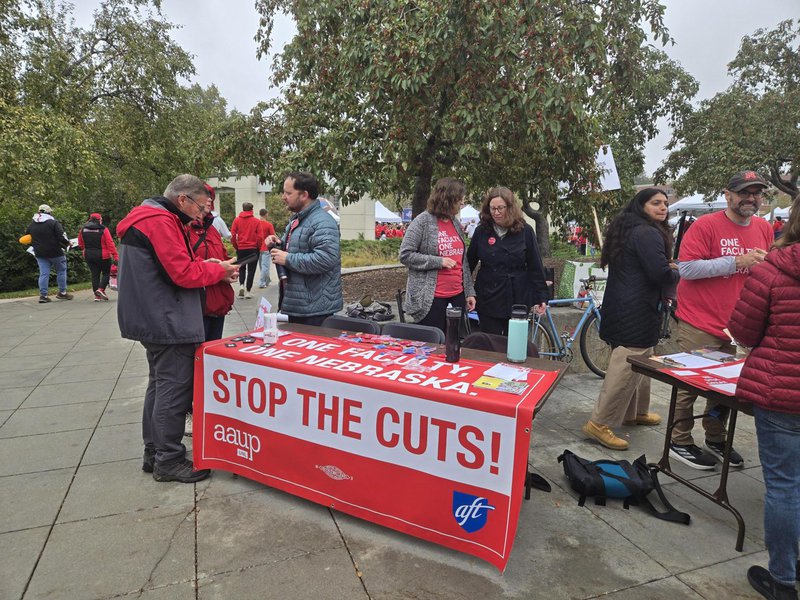
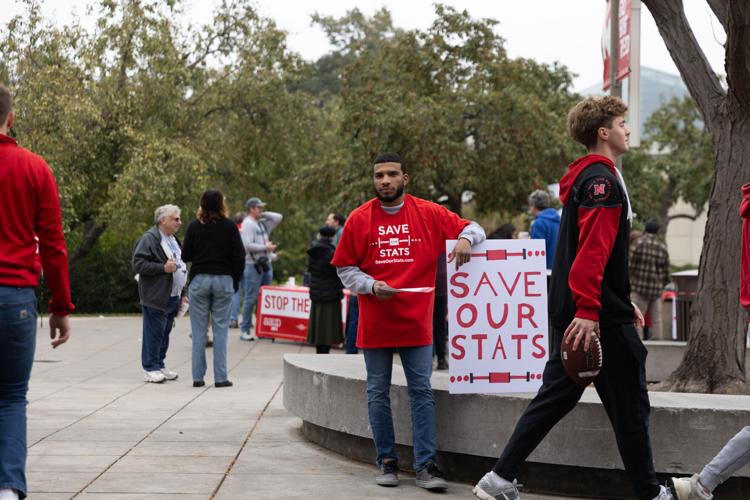
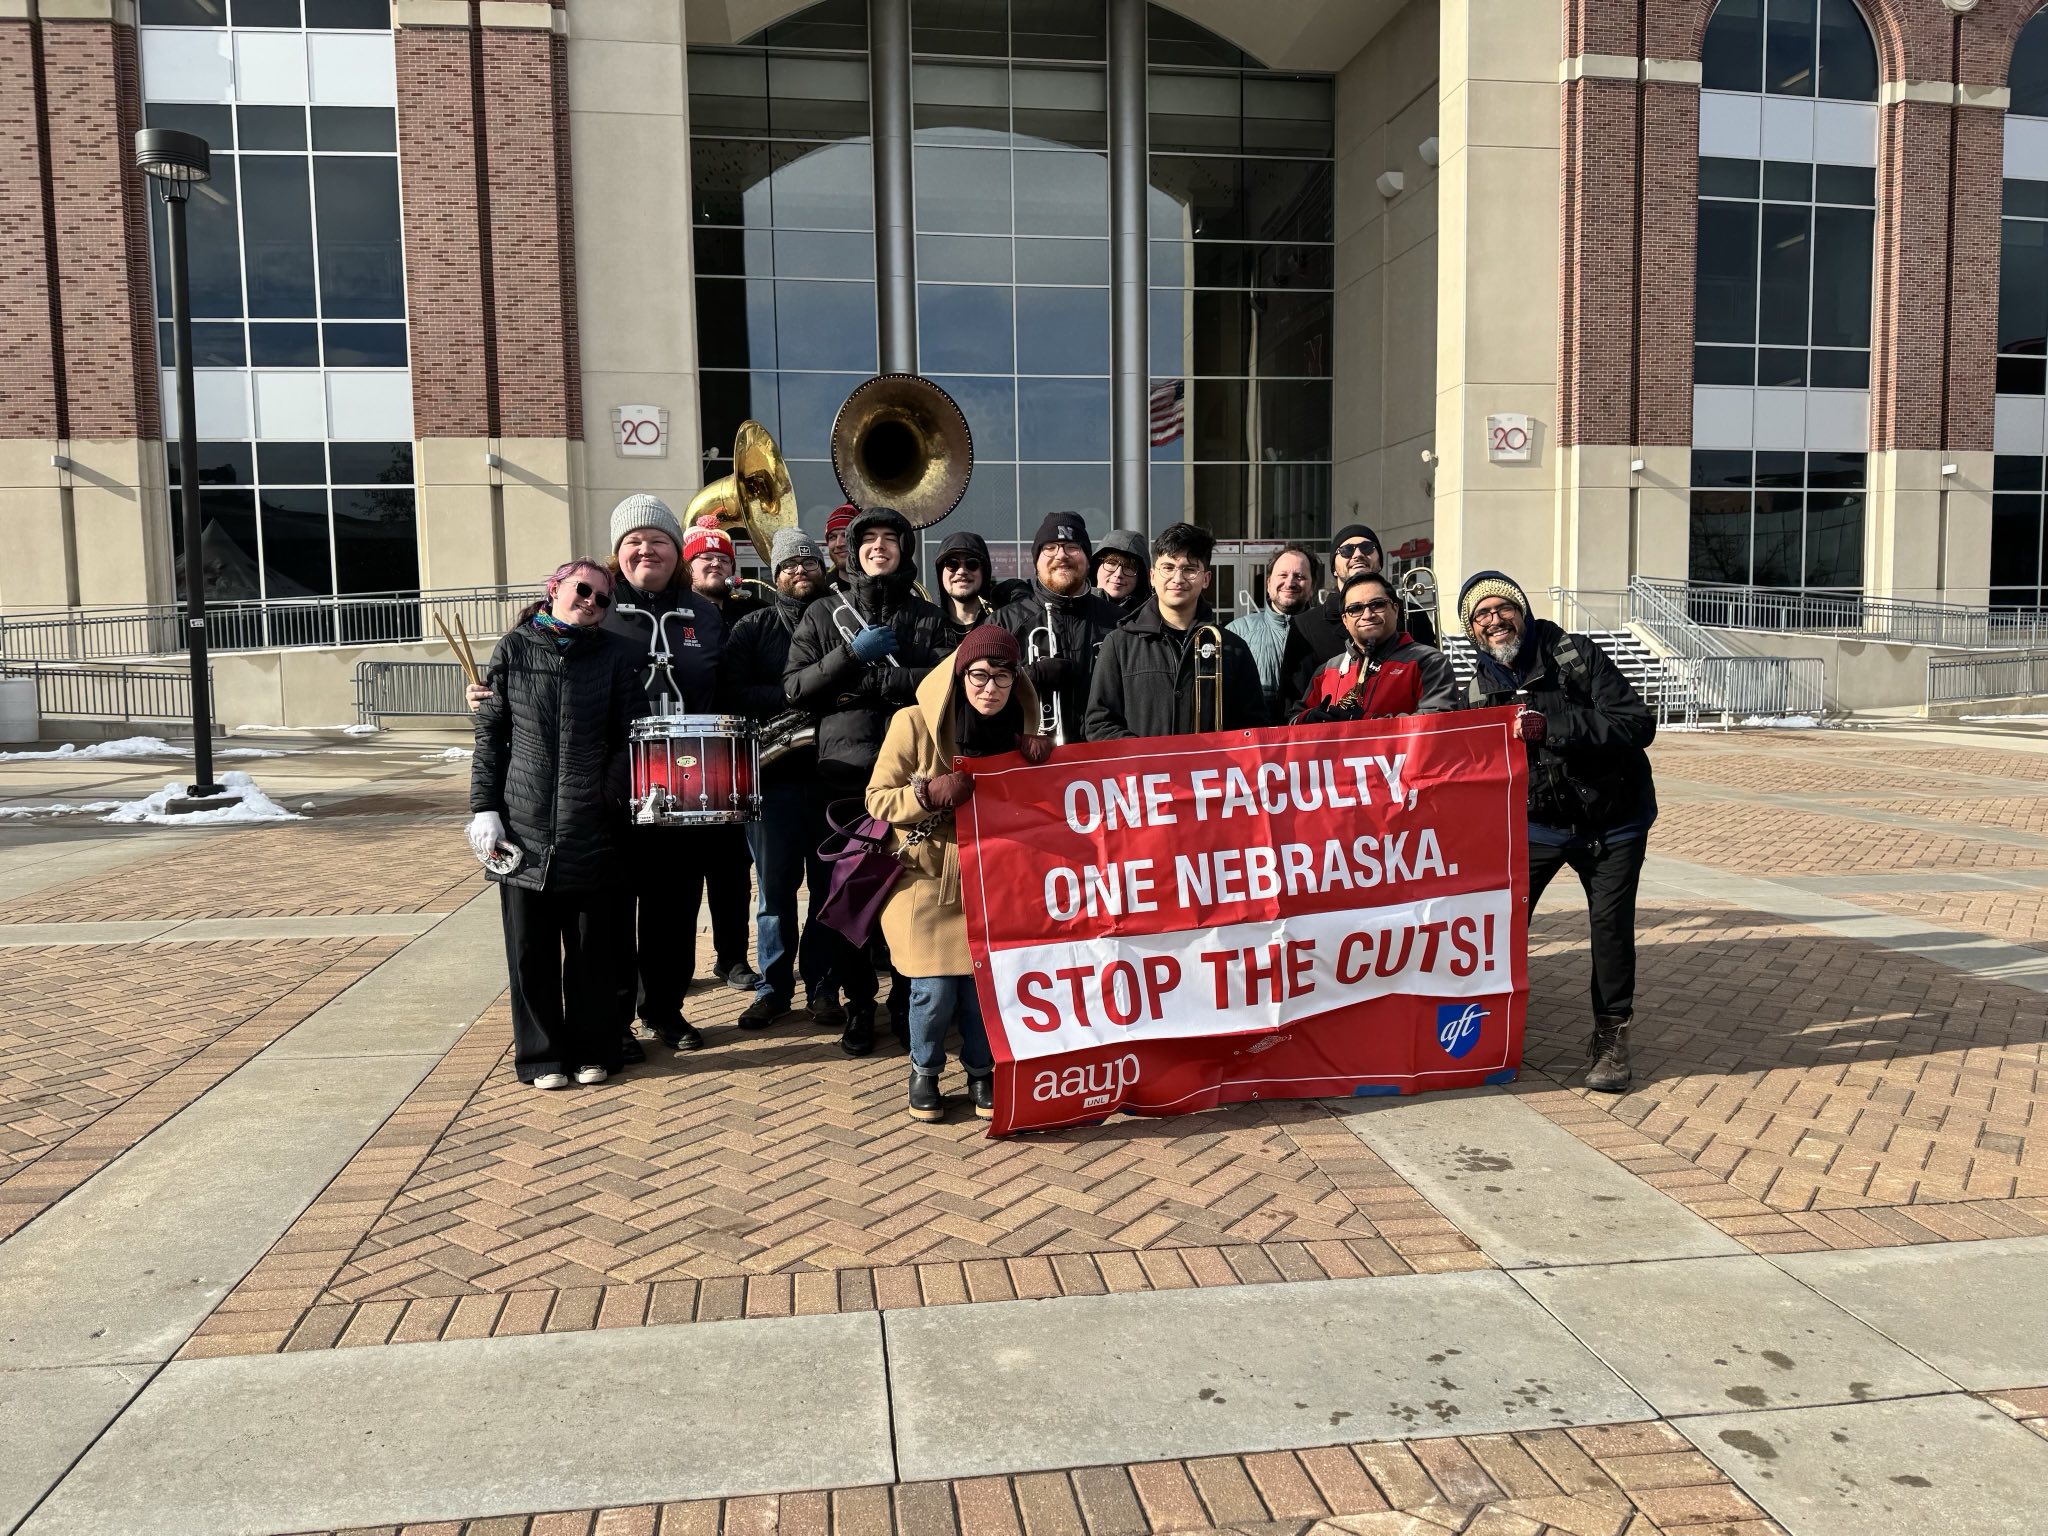
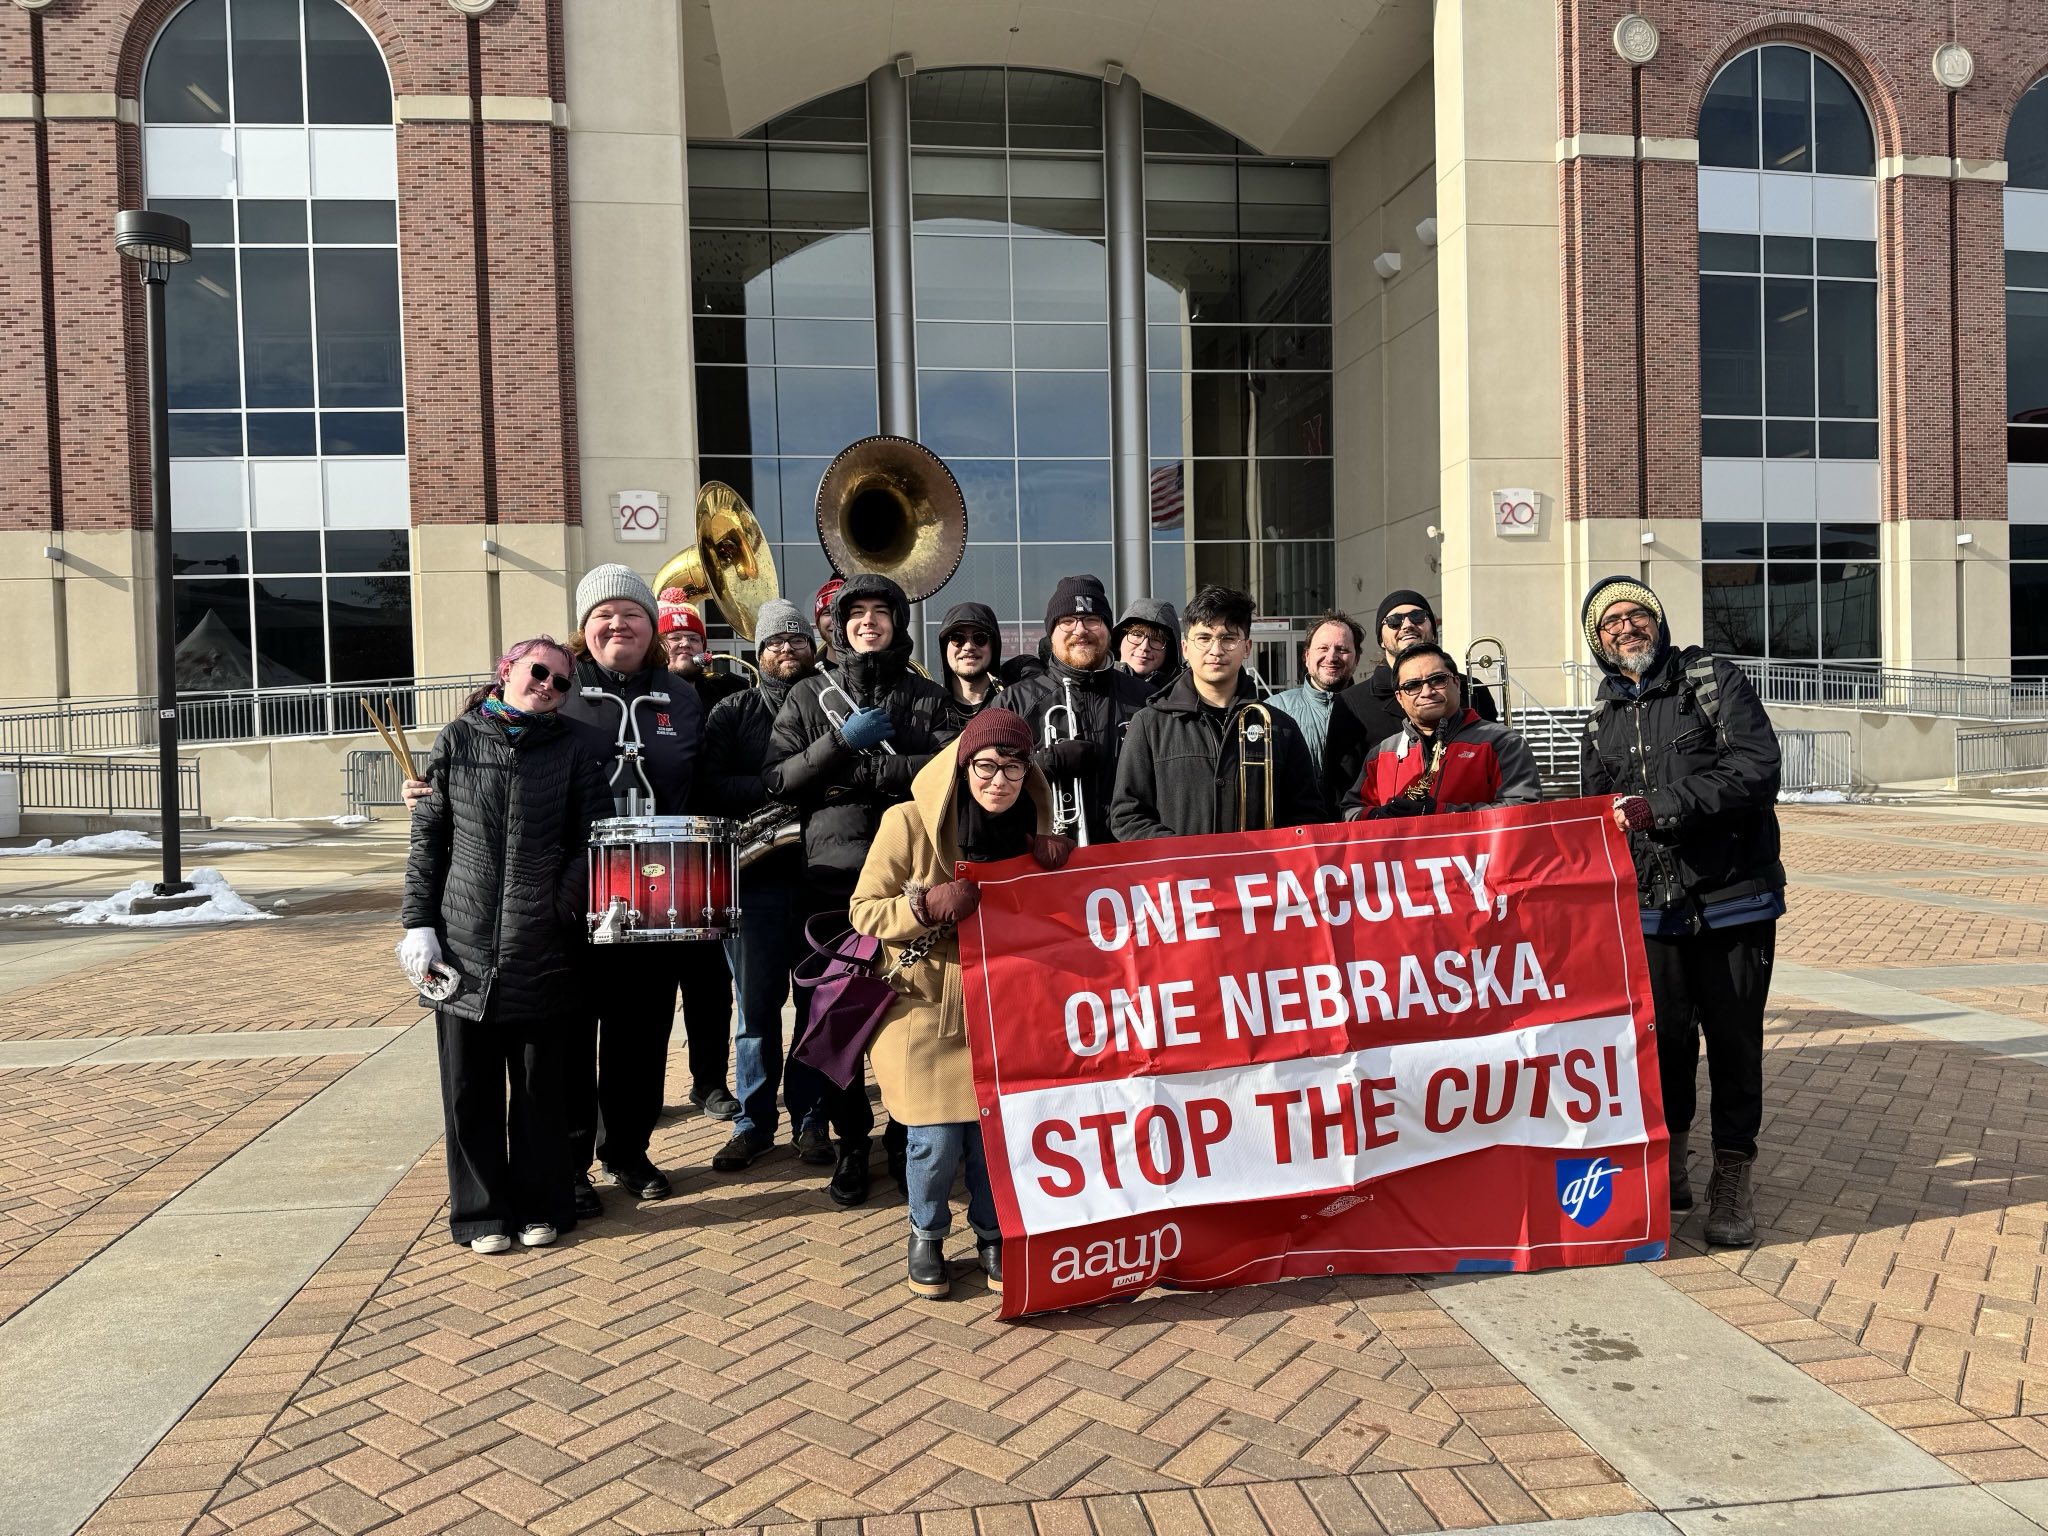
We held town halls to explain to the community why these cuts were problematic and how they would be impacted. We held a rally before a football game – the first time I’ve been on campus on game day as a faculty member – and talked to Husker fans and community members as well as those attending the game from out of state. We demonstrated that the cuts disproportionately impacted teaching relative to other growing spending at UNL, like administrator compensation, with help from AAUP financial analyst Dr. Bonnie Fox Garrity.
On October 30, the system-wide Graduate Council voted unanimously to retain all graduate programs that the Chancellor proposed to eliminate. Once again, they mentioned the metrics, the lack of planning, the essential place of some of these programs (Statistics and Educational Administration Ph.D.s are both highly ranked programs and are not found anywhere else in the state).
The APC report was released on October 31 and recommended against the elimination of the Statistics department10, but also raised significant concerns about the data and the metrics – indicating that the APC, at least, was receptive to the information the department had assembled.
During the time between the APC report’s release and the Chancellor’s report, we met with stakeholders, donors, and administration, trying to find some way to communicate to the UNL administration that eliminating Statistics was a horrible idea. We were told we had to find between 1.75 and 3 million dollars in equivalent cuts (increased revenue wasn’t going to work), and we could not propose the elimination of administrators or other departments. We argued that we should be placed in Arts & Sciences or the College of Engineering (specifically, the School of Computing) to better maximize our utility to the campus and to increase our ability to attract students – being off on the ag campus was commonly cited as a reason students chose not to major in Statistics and Data Analytics. We had a plan, and plenty of statistics showing that if the savings from centralizing statistics courses and consolidating them within our department were considered across colleges, we could in fact save enough money to cover our salaries. However, our former dean and current vice chancellor undermined our arguments and made it clear that she would prefer to eliminate our department and keep our service classes, rather than allowing statistics to move to another college. The problem is, we’re the only department in the ag college that teaches a bunch of service courses that are required for students in other colleges, and that revenue is keeping other programs afloat. So, the College of Ag Science and Natural Resources can afford to eliminate statistics, but it can’t afford for us to move. Funny, right?
We made the Chronicle of Higher Education. In an attempt to explain the problems with the metrics more broadly, we invited the leadership team to come to a joint seminar – but they declined, so we gave the seminar anyways. It was a lot of fun to present, and undoubtedly was the best-attended Statistics seminar in UNL’s history, with more than 100 people in the room and at least that many online. The YouTube video has about 1100 views as of December 3. One of my friends texted me from the seminar to say “Who knew you were actually funny IRL?” – which is totally fair, since we’d primarily interacted online.
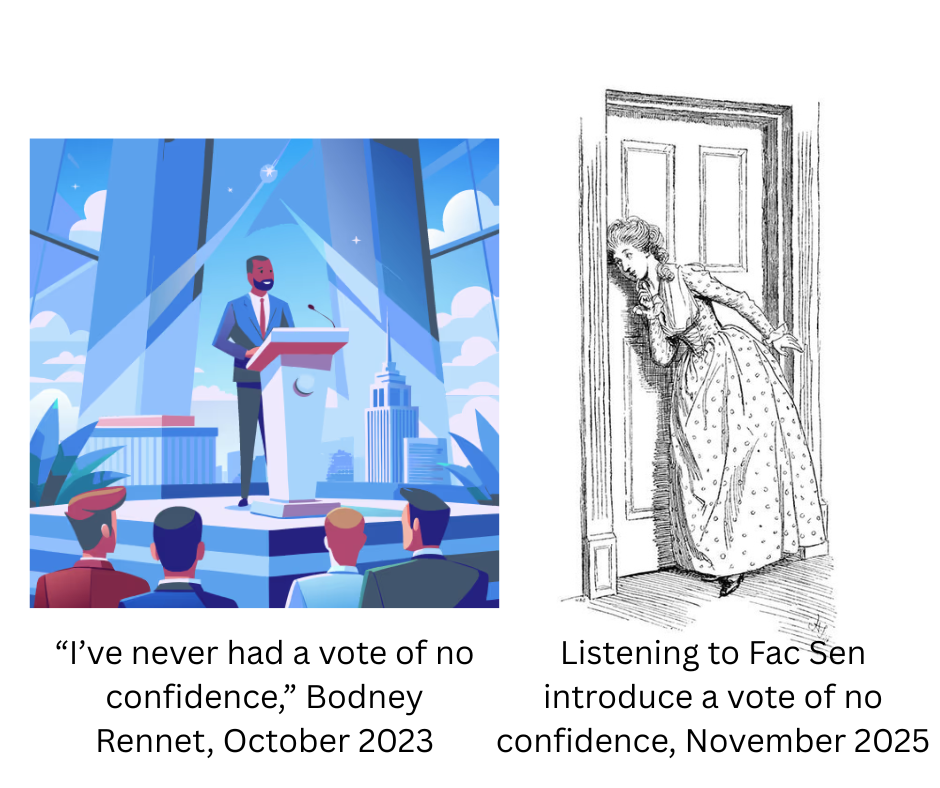
No Confidence… and then some Somewhere in here, the Faculty Senate voted to have a special session to consider a no-confidence vote against the Chancellor. A vote of no-confidence has only happened once at UNL in the past, during the last round of cuts that actually involved program eliminations, but the vote failed. This time, it passed – making history. One of the reasons this is particularly amusing is that Chancellor Bennett introduced himself to the Senate after taking the job by saying he’d never had a no-confidence vote against him (which is itself not exactly a measure of confidence). My friend Amanda’s description of the faculty senate meetings in the Bugeater is much better than anything I can do to describe the farce that was discovering the Chancellor was listening at the door during the first Senate meeting (Figure 4). The actual vote was broadcast on so many news channels that it would have been unnecessary to listen at the door (also, my lovely students were watching to see if he would - evidently he wasn’t listening at that one).
Ultimately, on November 10, the Chancellor released a budget plan that was similar to the original, minus the cuts to landscape architecture and community and regional planning. Those departments were lucky to have their dean on the APC, and both were very small programs who could work out alternative cuts with their dean. Larger departments and departments with interim/new deans not on APC were not as lucky.
The department kept working, appealing to the University of Nebraska System Provost, individual members of the Board of Regents, and the system president, Dr. Jeffrey Gold. When a special meeting of the Board of Regents was called, I went to point out the financial implications of eliminating revenue-generating departments.
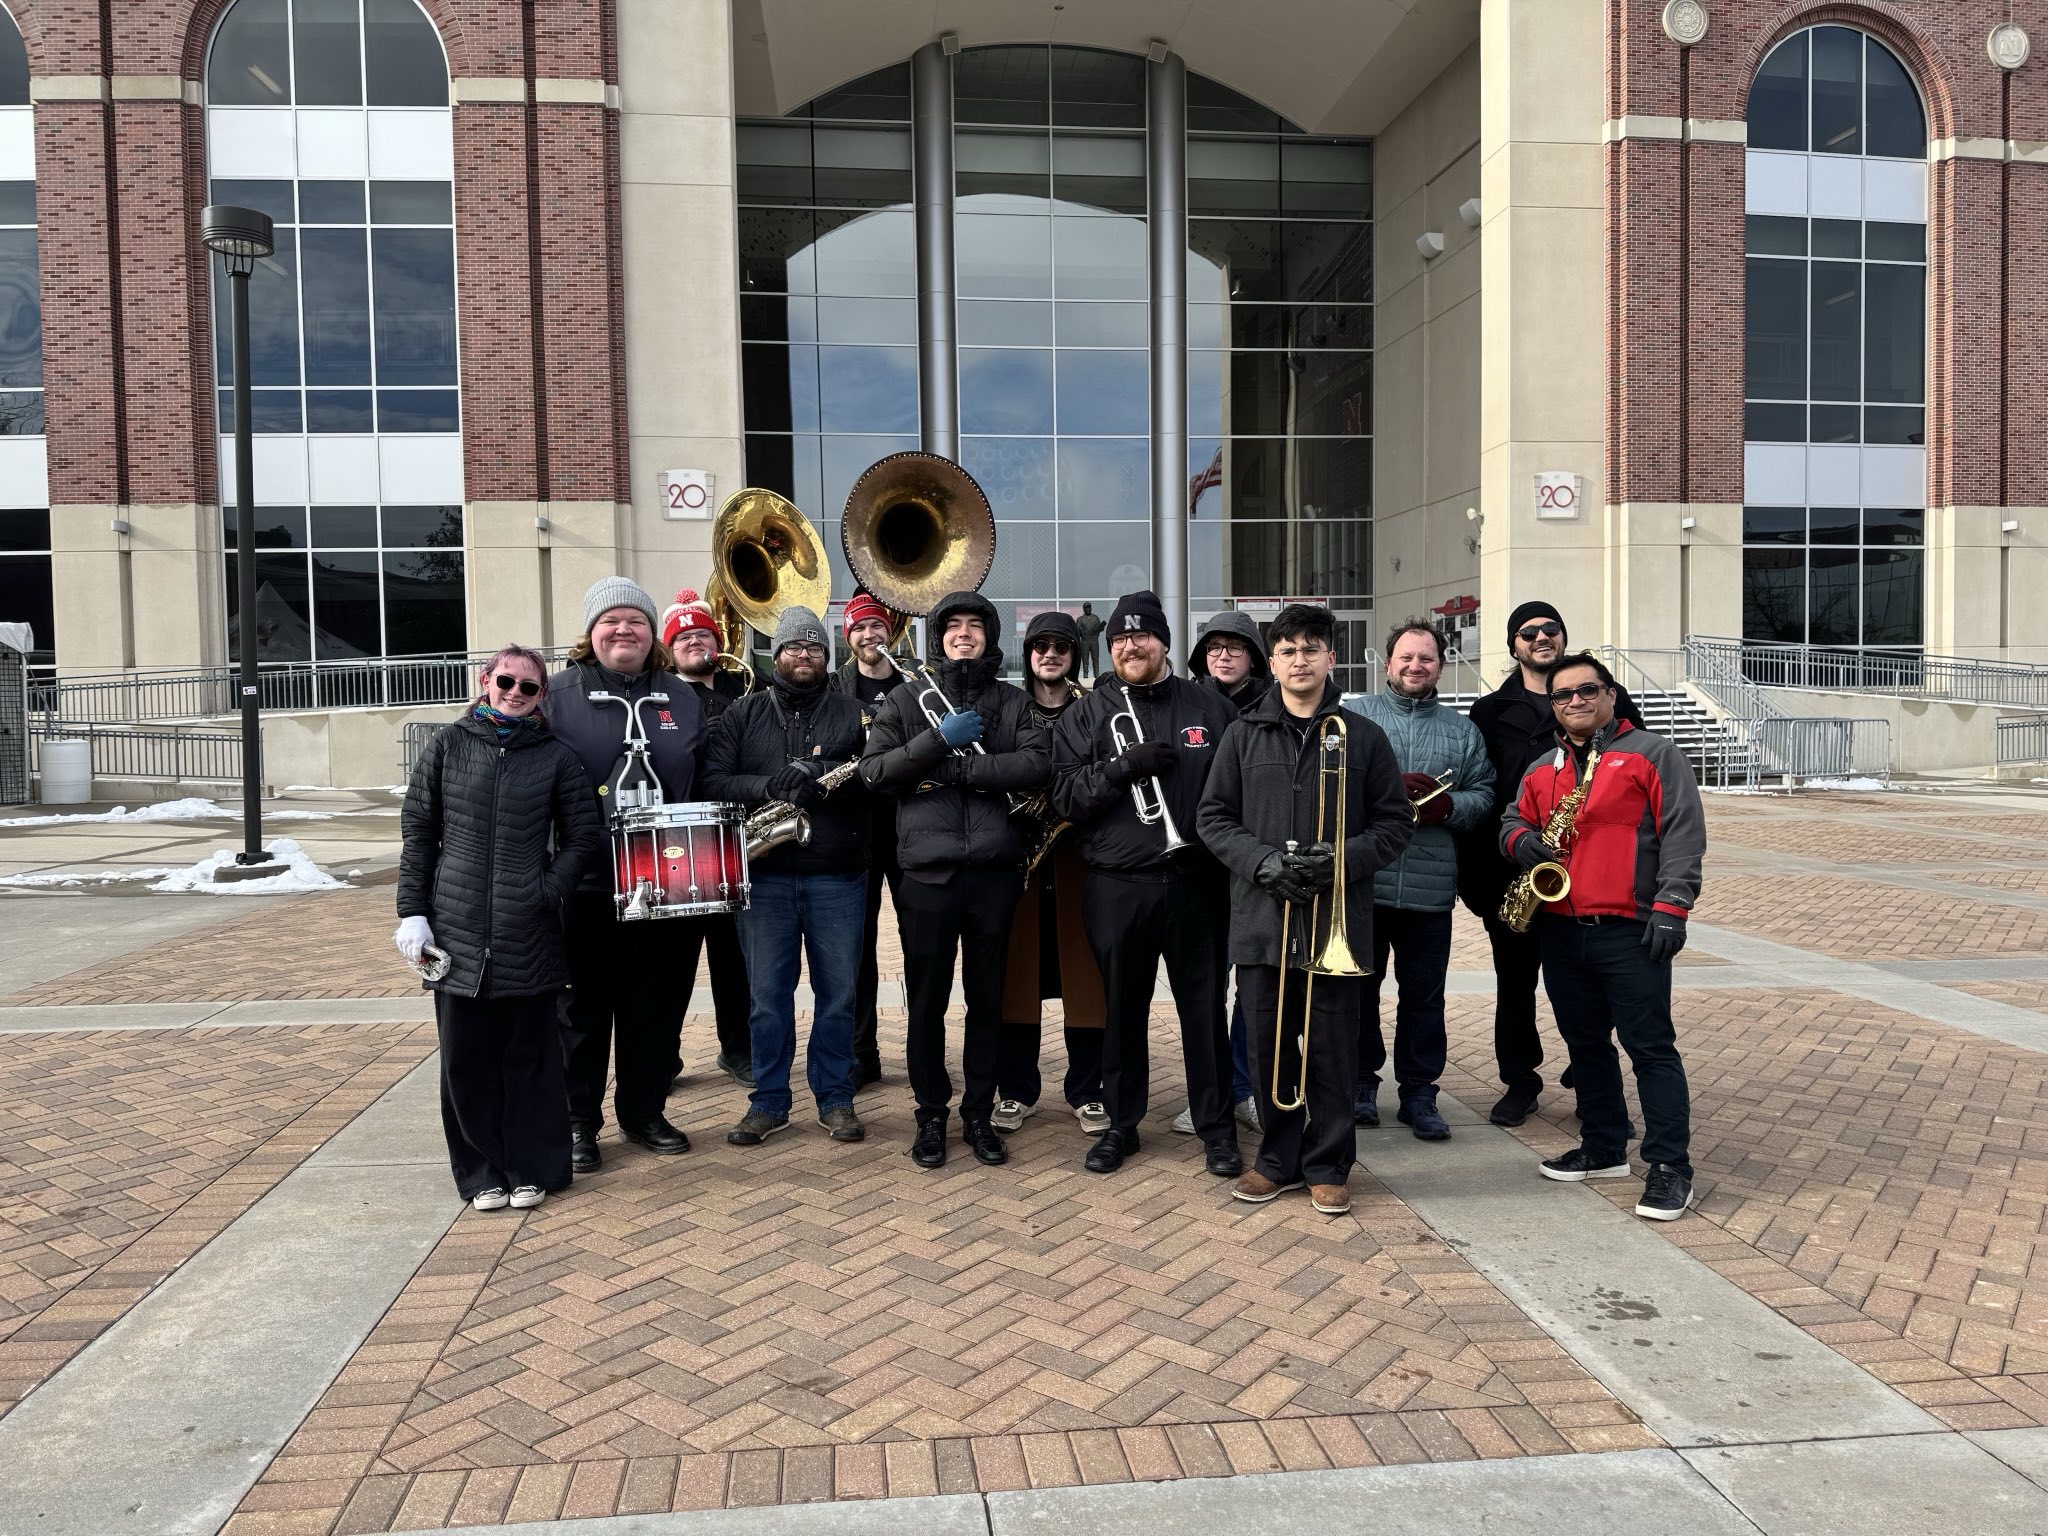
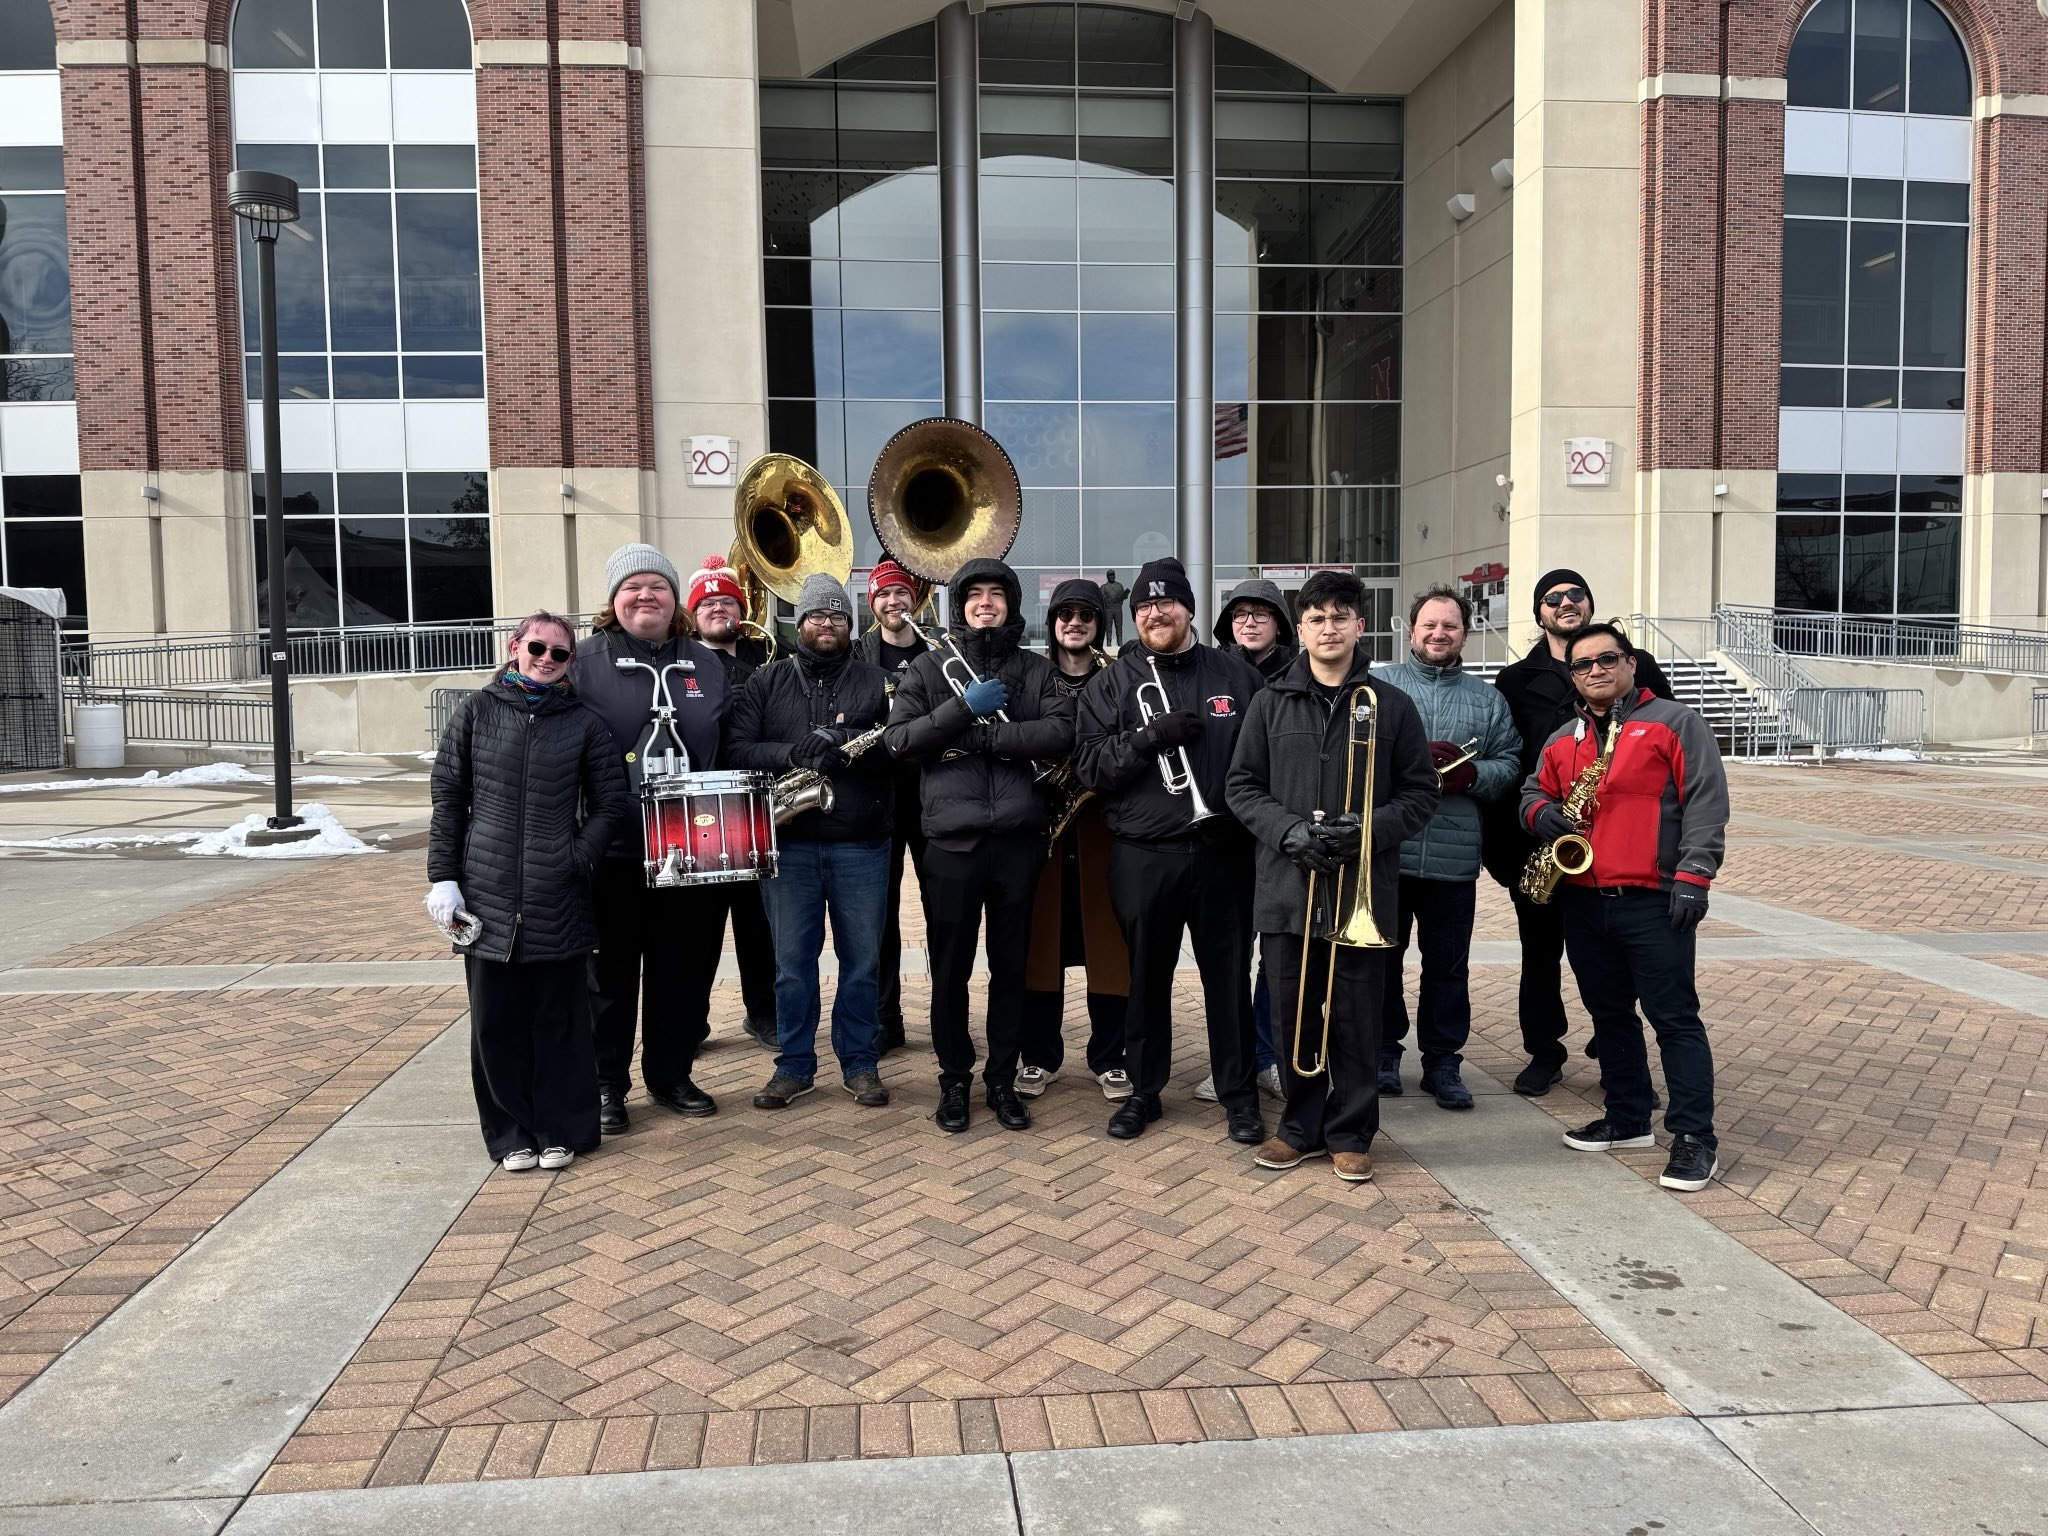
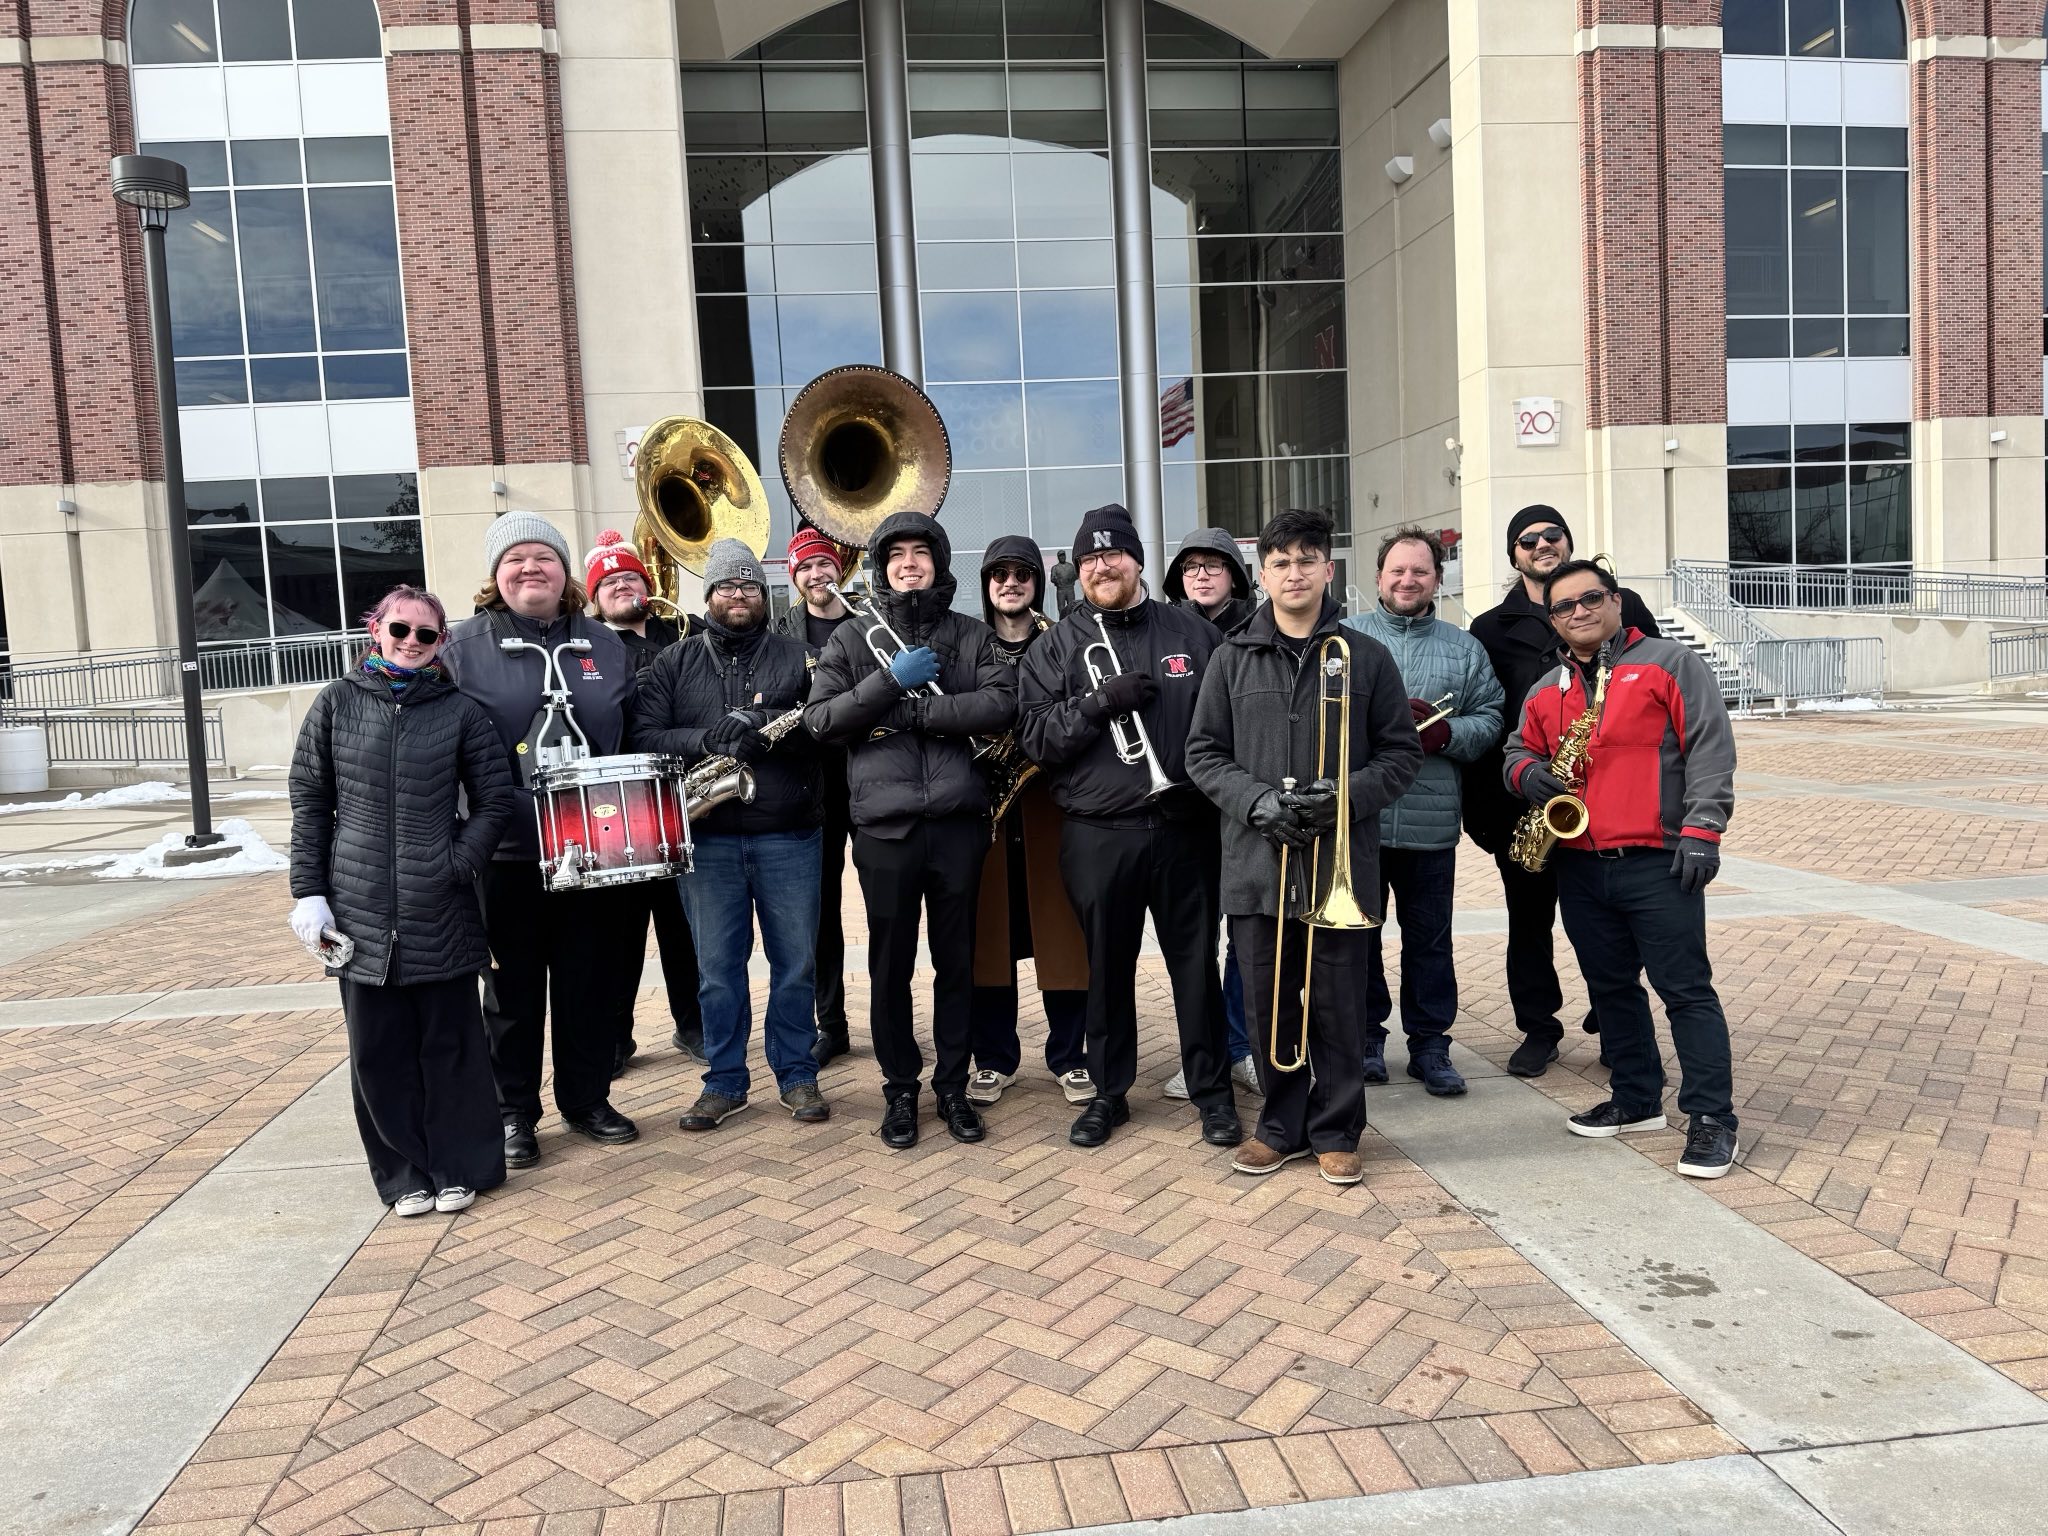
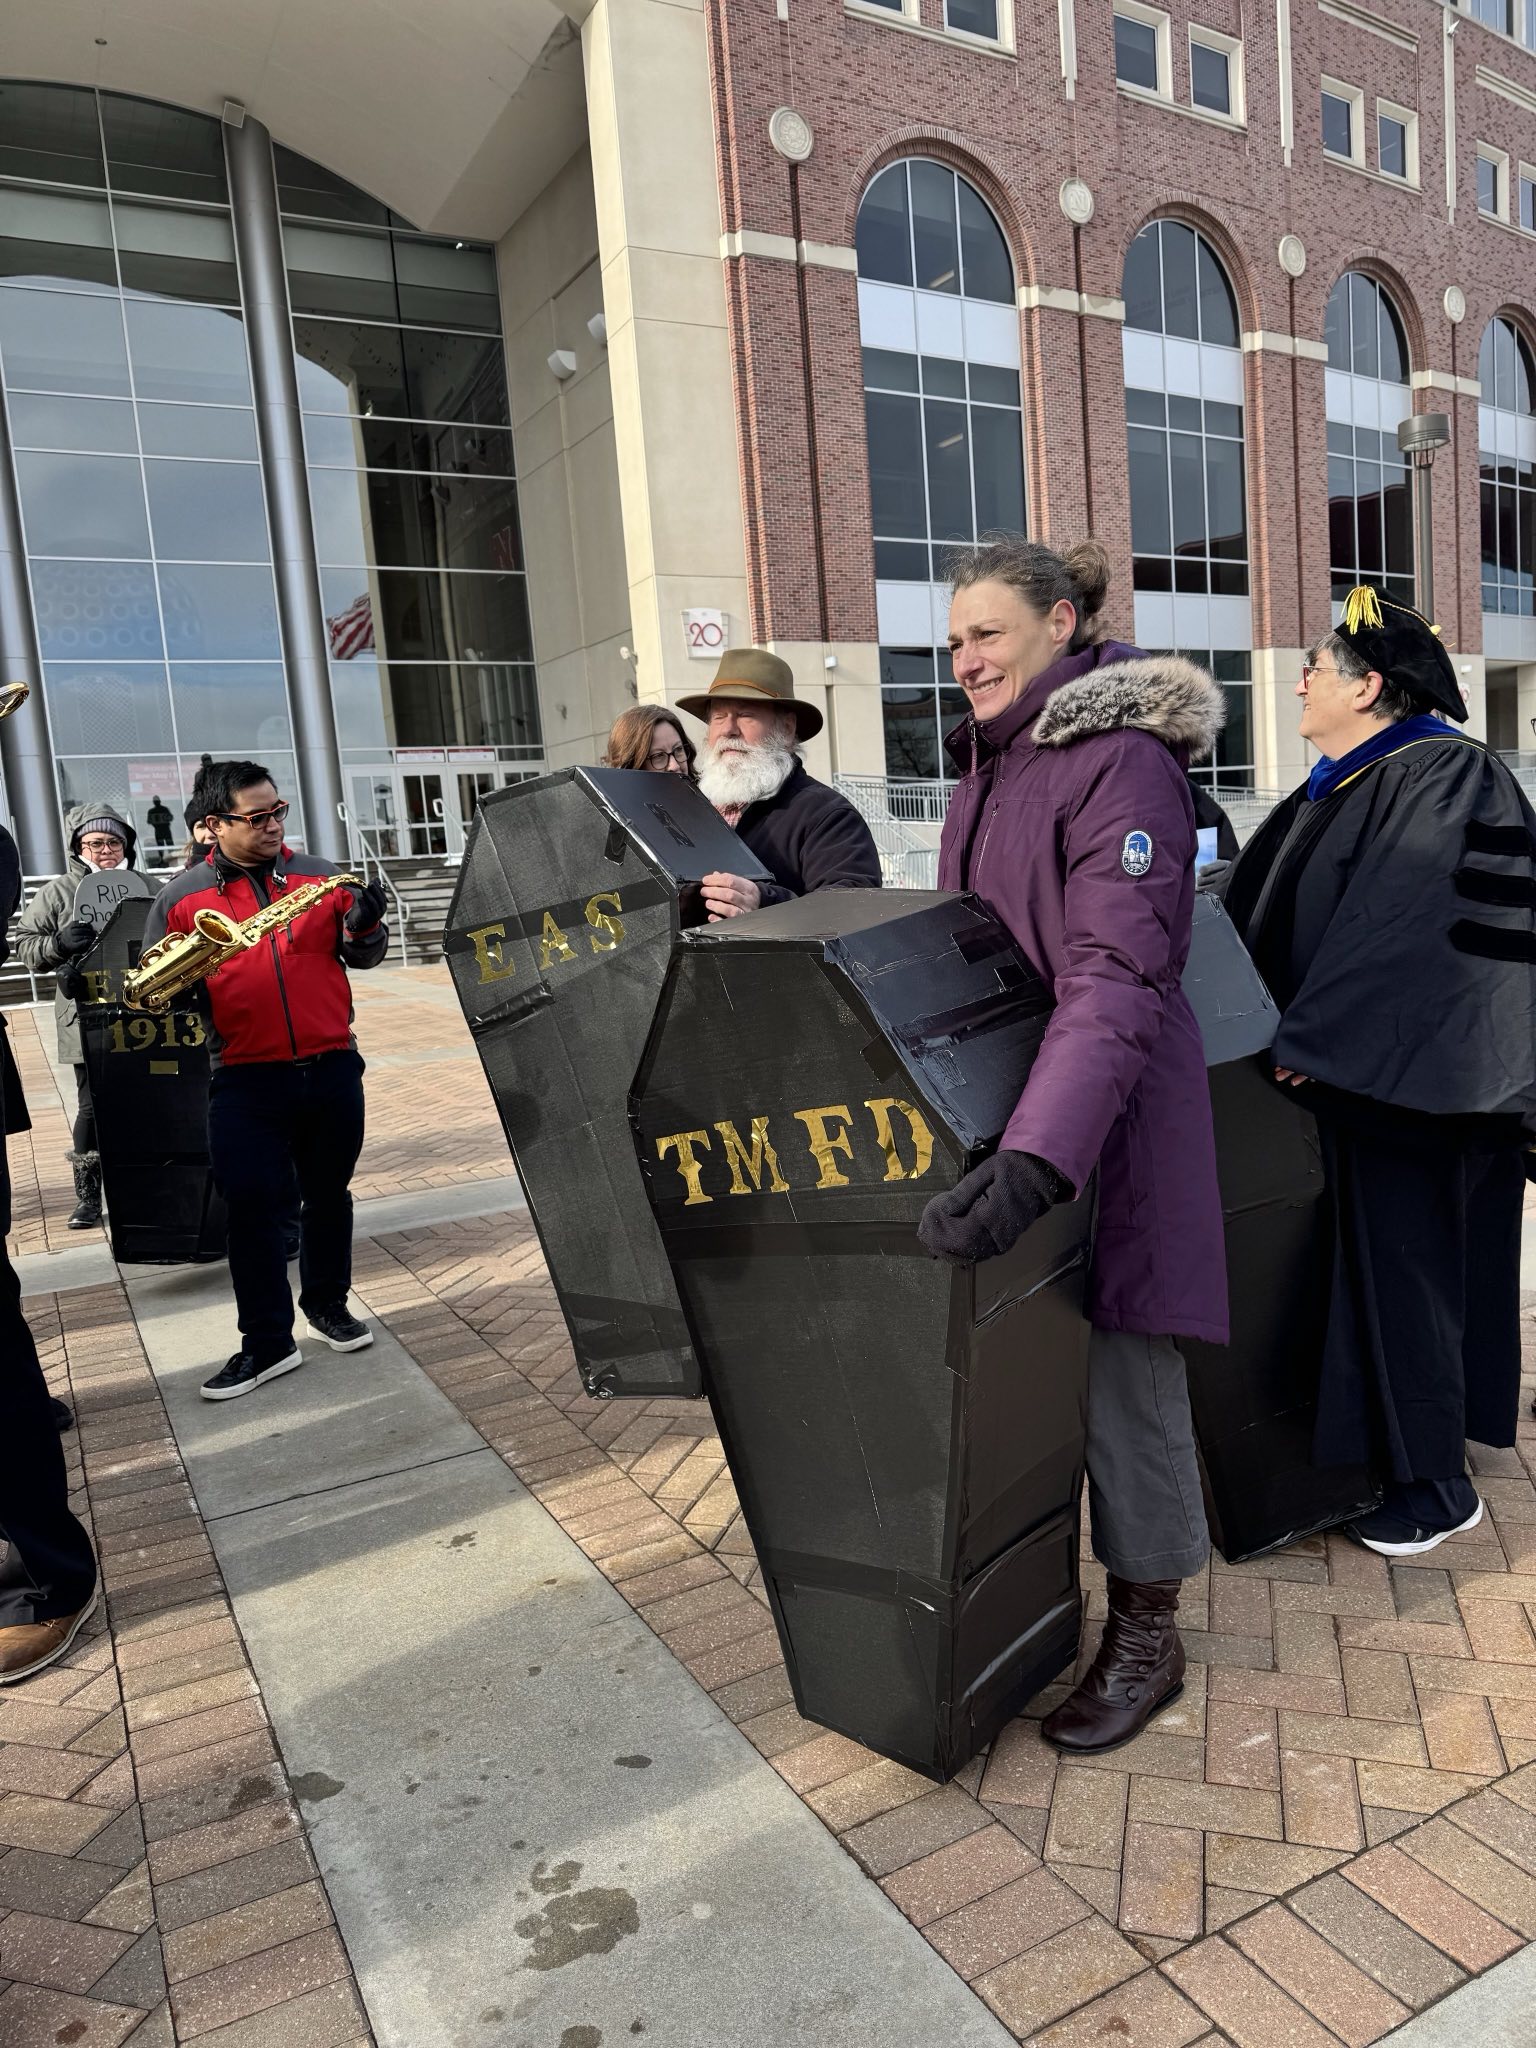
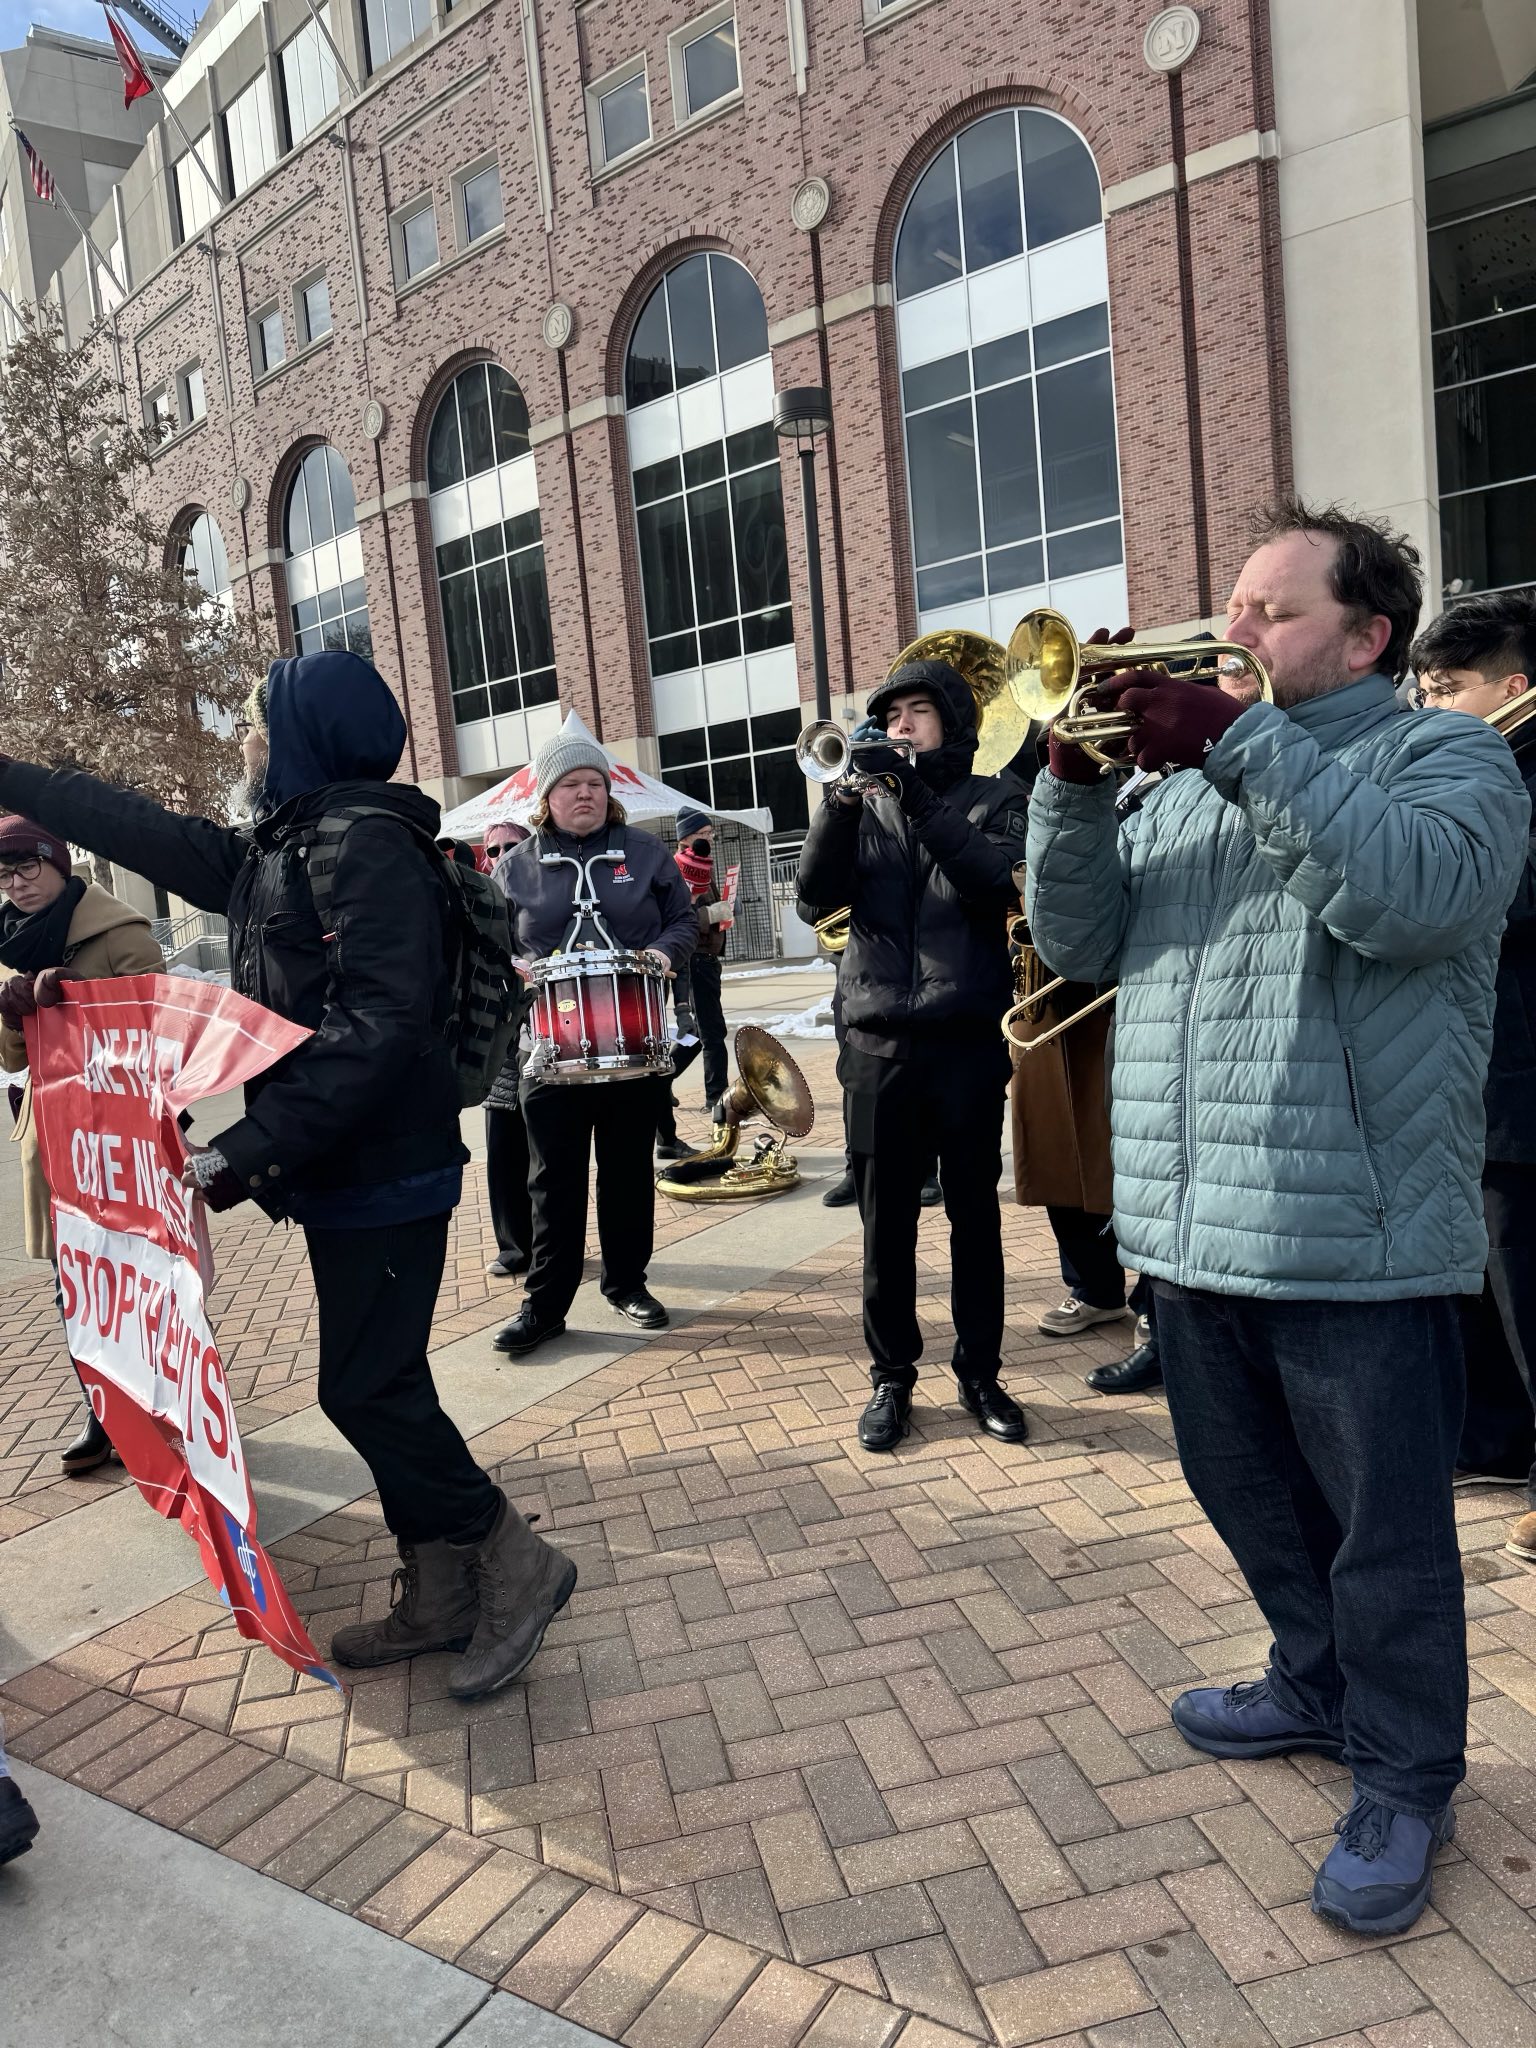
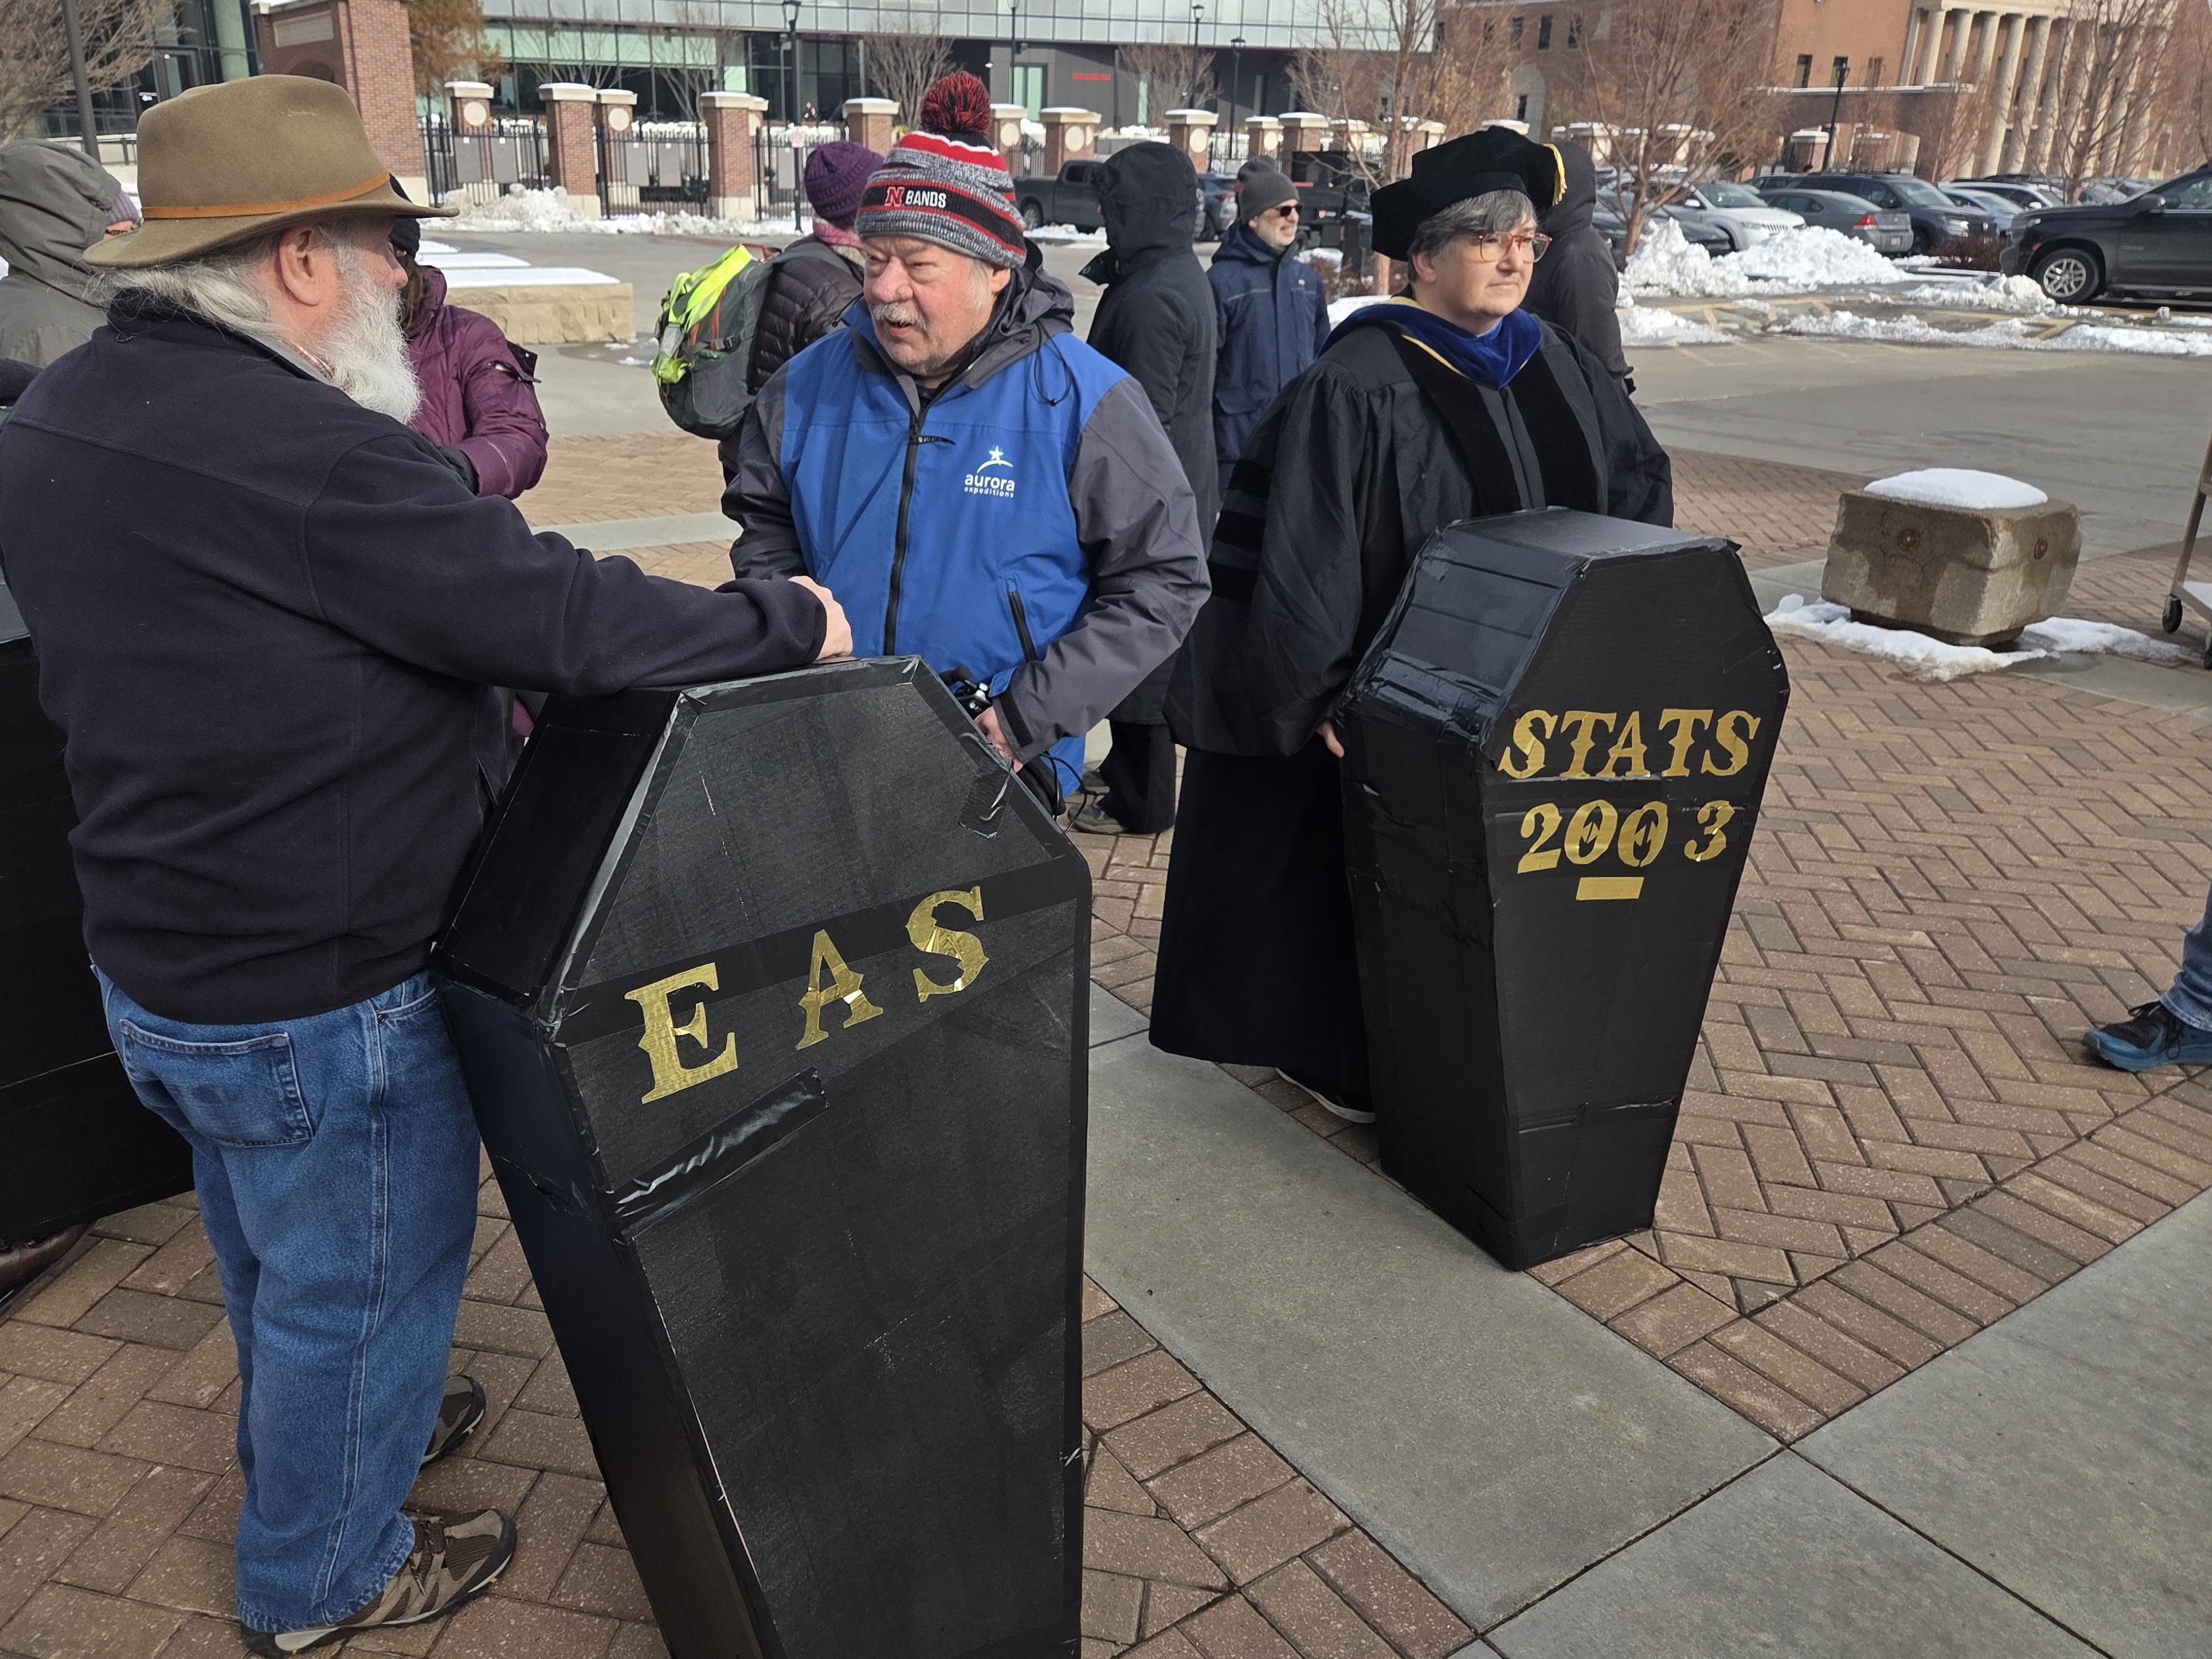
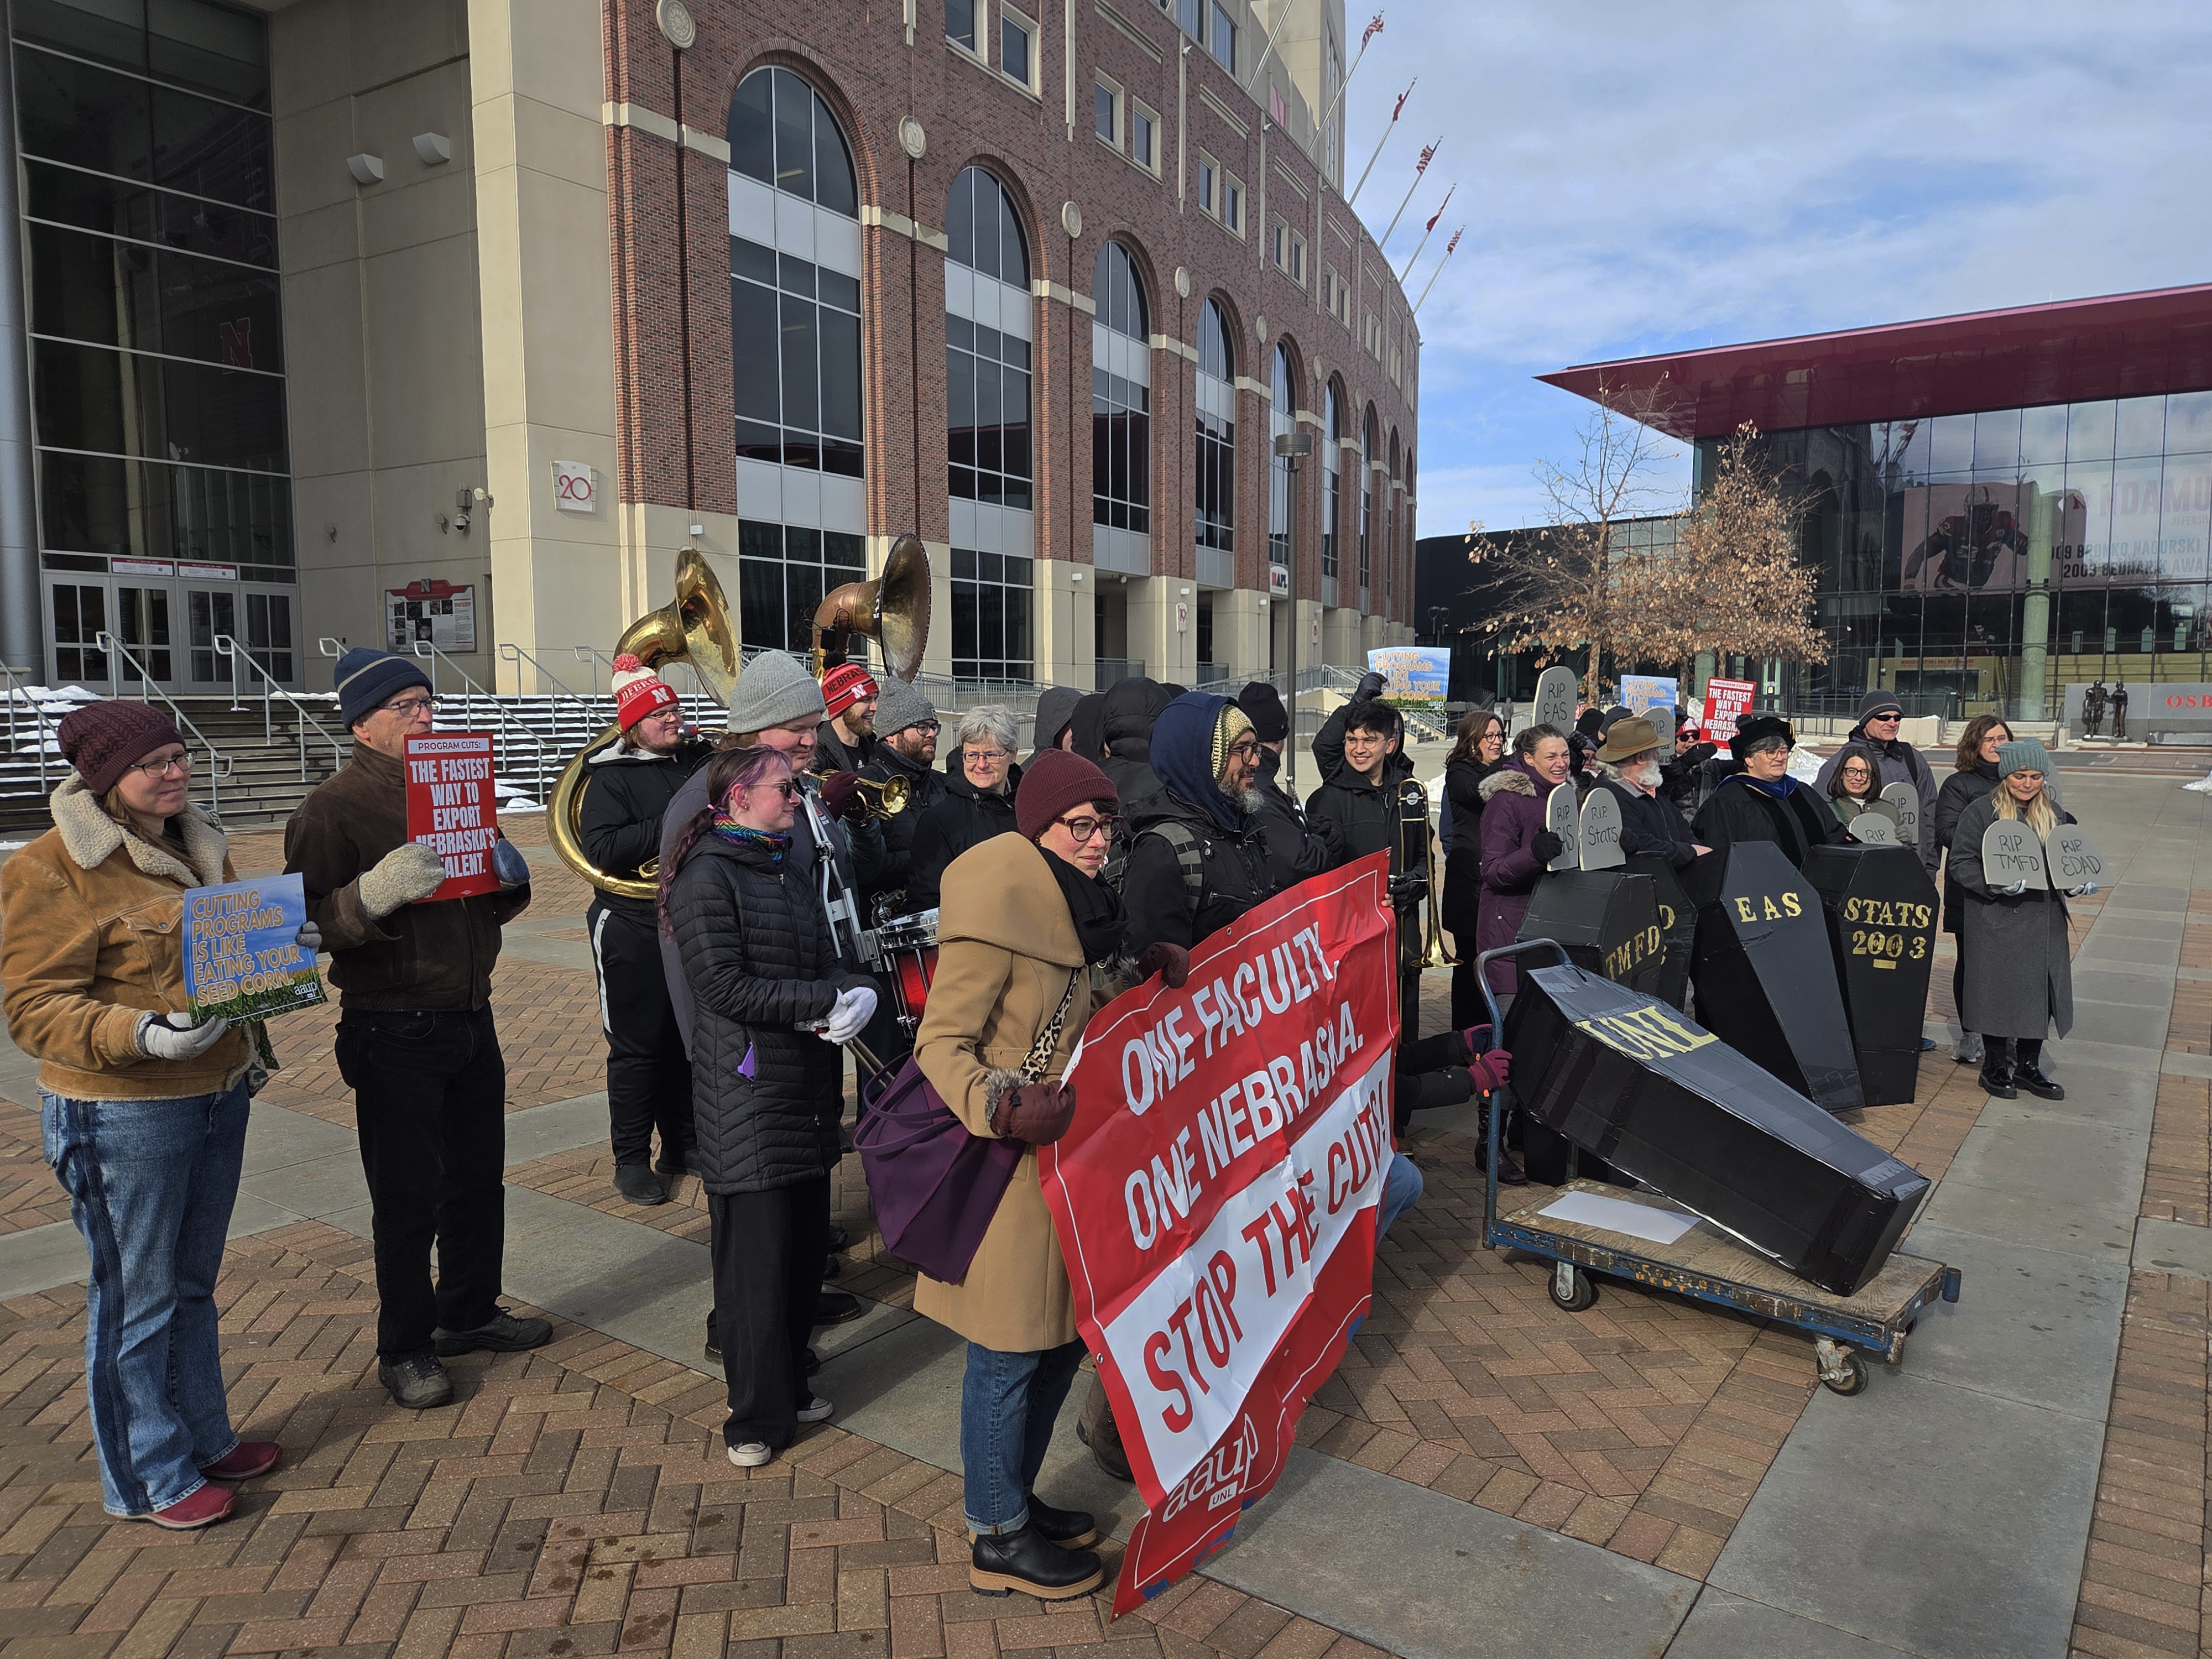
The AAUP chapter planned a full week of demonstrations leading up to the Board of Regents meeting on December 5. We made phone banked to turn out faculty to speak at the Dec 5 meeting, made signs, held a full on New Orleans style funeral with a jazz band (and it was freaking cold), had rallies at both student unions… it was a lot, but my favorite was the Jazz Funeral, complete with caskets for each department and the university, academic regalia, gravestones, coats, and amazing jazz by students and faculty in the music department.
Writing this on December 311, I obviously don’t know how this is going to go. It feels like every I’m on the world’s weirdest, most inconsistent roller coaster - despair, then 5 minutes later hope, and then despair again. Ultimately, though, even if we save the department or some of our programs, we’re likely to lose in the long term - it’s going to be hard to recruit faculty to UNL knowing that our administration makes cuts like this. We already didn’t have enough faculty to teach everything we needed to teach to offer our programs. And ultimately, there are a lot of very good schools hiring this year - University of Chicago, University of Virginia, University of Illinois, Oregon State, Johns Hopkins, Princeton, Harvard, Boston University, Rice, Texas A&M… the list goes on.
I’ve helped to build our undergraduate program from the ground up, designed the computing and technical tools sequence (including a writing class!) and it’s very much my baby. I’ve fought for my program, for my friends’ programs, and for my institution. But maybe it’s time to recognize that it may be more effective to pour that energy into starting over somewhere else - somewhere with a committment to statistics, data science, and interdisciplinary research.
Extra Pictures!
Footnotes
FWIW, the administrative assistant is the most critical person in the department and basically runs the place but is paid terribly. We might have benefitted from having a part-time chair and 3 admin assistants!↩︎
Note that this is a function of student credit hours (SCH) and expected tuition per credit hour, accounting for in-state/out-of-state tuition revenue. This is complicated for graduate students, since their tuition may be waived if they are serving as teaching or research assistants. However, research grants are still billed for this tuition, along with graduate student benefits, and teaching assistants are billed to the department using what seems to be the same logic. So while it’s hard to estimate how much of the graduate tuition is real money, we can estimate how much value is generated – the rest is accounting. It’s a bit funny that we might be billed for graduate tuition for our teaching assistants, while that same tuition money doesn’t count as department income because it’s considered tuition remission. University accounting might be more screwy than Hollywood accounting.↩︎
CCPE requires an average of 3 PhD graduates per year, 5 MS graduates per year, and 7 BS graduates per year, averaged over a 5-year period. Critically, programs which do not have 5 years of graduation numbers because they are too new are exempt from evaluation – our BS program falls under this criteria, having started in 2022 and thus not having any graduates until this December/May. Otherwise, we clearly meet the CCPE requirements, even with the cyclical nature of enrollment in graduate statistics programs due to economic conditions. When the economy is booming, it is hard to recruit statistics graduate students because they reasonably choose to make $100k+ in industry working 40h/wk over making $25k in academia while working their butts off. Only the truly dedicated/insane students go to graduate school under economic conditions that heavily reward quantitative expertise. Trust me, I graduated with my BS in 2009, at the height of the great recession – many of my peers who weren’t planning to go to graduate school did anyways because there wasn’t anywhere else to go.↩︎
Which, of course, the 2020-2024 period was… not, for a variety of reasons, including a booming economy that affected statistics student recruitment, the pandemic and recovery from the pandemic, and faculty turnover due to retirements that were easily foreseeable from the department composition – when I was hired, there was a single associate professor who had been hired 6 months before me, and there were several assistant professors and full professors. 5 years later, those full professors were retiring (shocker!) and several of the assistant professors had moved to other universities.↩︎
This is pretty much what Ph.D. Stats students use Cauchy distributions for – counter examples, and setting conditions on important theorems like the Central Limit Theorem, which doesn’t apply if the distribution has infinite variance.↩︎
I’m a big believer in using profanity for rhetorical emphasis and pain relief. Unfortunately, I’ve run out of adequate profanities during the last 3 months.↩︎
Wrongly attributed to Heicke Hoffman, her alter ego/doppelganger.↩︎
Essentially, UNL operates as if Nebraska State and University of Nebraska were operating out of the same campus, but with two different lines of funding from the state that require two different sets of administrators to manage those appropriations. /s↩︎
There are not nearly so many communists and socialists on campus as conservative media would like you to believe, however, and those who choose those labels would only brainwash students to read the syllabus, which is a common opinion across the ideological and discipline spectrum. Just like middle school teachers would brainwash students to wear deodorant, with every other possible topic of brainwashing lost in the distance compared to grooming standards like “Axe is not a substitute for a shower”.↩︎
It is worth noting that about half of the APC is made up of faculty and half is administration and staff. Administrators, including all four members of the ELT who were responsible for creating the original proposal, refused to recuse themselves from the vote.↩︎
Instead of catching up on my grading or writing an exam… whoops.↩︎