Appendix D — Notifying Administration of Metrics and Data Issues
On September 26, members of the statistics department contacted several members of the Office of Research and Innovation and the team reported to be responsible for assembling the data and the analysis of the data used as quantitative measures of department performance during the budget reduction process.
Everyone,
The Statistics department has been preparing for the APC hearing by digging into the data, and we have discovered a problem with implications not only for the budget proposal but also for UNL’s plans to rejoin the AAU. IANR leadership has indicated that any issues with the metrics used for budget cuts should be brought to the attention of ORI (for research) as soon as possible.
We have discovered that the UNL computations based on SRI produce misleading results (e.g. the z-score comparison method). Yesterday, we met with an Academic Analytics analyst and confirmed our suspicions. Ultimately, because SRI is a discipline-specific weighted average of different research factors, creating z-scores from SRI metrics is problematic and destroys the signal available in the data, particularly when those scores are calculated across different disciplines with different weightings. There are alternatives that would allow for cross-department comparisons, and we would be happy to discuss those alternatives.
In the case of the Statistics department, the SRI numbers from Academic Analytics indicate that we are performing at a level of productivity equivalent to leading departments in Statistics ??? Iowa State, Michigan State, and Univ Illinois Urbana-Champaign, among others. Obviously, this is a far cry from the z-score SRI provided to the department that indicates that we’re performing poorly relative to other departments on campus.
We would like to meet briefly at some point between now and Tuesday to explain the issue and demonstrate the problem for our department, because this discovery has the potential to inflame an already volatile situation as campus reacts to the proposed cuts. If we have missed anyone who needs to be included in this discussion, please feel free to forward this and to include them in the meeting.
Thanks,
We received a response back from someone in ORI (names excluded because they really aren’t necessary here).
Apologies for the delay in getting back to you sooner, I was in meetings all day yesterday and had a university event that ran late into the evening.
The SRI for Statistics when the data snapshot was taken in May using AAU public institutions as a peer group was -.1. The Z score that resulted when comparing Statistics SRI to other UNL departments was +.549 indicating that on the SRI metric, Statistics is performing positively relative to other departments on campus.
Please let me know if you’re seeing something else in the data which leads to your understanding that the department was performing poorly relative to other departments on campus.
Kind regards,
Well, that’s great, but that wasn’t the issue we raised at all. We specifically identified that SRI z-score calculations were problematic, and that we’d confirmed with Academic Analytics that cross-discipline calculations are not appropriate using SRI (0.4) or custom SRI (-0.1). As we only had data from statistics, that was the only data we could use to demonstrate the problem – but the issue really wasn’t that Statistics had low scores so much as that the method was incorrect for the data.
<name>, that’s not the issue we want to discuss. The issue is the way that UNL has used SRI - a z-score is fundamentally inappropriate for this comparison. This has several implications beyond statistics that I want to make you aware of ??? there are at least 11 departments that are absolutely hurt by the way the averaging process was performed. I recognize that SRI isn’t the only metric used (but that is itself a concern ??? there are some other issues with how the research metrics are put together).
For what it’s worth, we confirmed our interpretation of this issue with someone at Academic Analytics before we reached out. So while yes, this has some implications for our department, it has many more implications in terms of how the decisions were made to cut departments overall. If you’re willing to meet at some point today I would be happy to stop by.
Another faculty member responded in kind:
The treatment of SRI is only one of the issues that we found in the analysis. I’d be happy to show what you are missing when dealing with SRI simply as one of the metrics. Grant numbers are severely underreported for Statistics faculty but included in the metrics multiple times. Despite being assured that faculty with secondary appointments would be appropriately included in the evaluation, this has not happened for any of the joint appointees in Statistics. I am also worried about the fallout from excluding the performance of 1/4th of the faculty hired after the cutoff date for Academic Analytics.
I realize that we will not change policies at this stage, but I would like to give you a chance to handle the factual errors before this becomes public knowledge and further damages the university’s reputation beyond the initial proposal to cut Statistics.
Finally, we received a positive response from the Office of Research and Innovation:
<We> would be happy to meet with you on Monday morning. Can it work to schedule 30 minutes sometime between 8-9:30 am? We can meet in 301 Canfield Administration. Let us know if there is a time that can work.
We set a time (8 am, Sept 29) and presented slides (http://srvanderplas.github.io/2025-stat-apc-report/statistics-slides.html) describing the problems we had identified to date.
On October 7, at 10pm, we received a document from the Office of Research. We have reprinted the document here with some information redacted to protect individuals’ privacy.
Response to Statistics
On behalf of the Executive Leadership Team and data analytics team, the following are responses to questions asked by Statistics faculty regarding the UNL budget reduction process and the metrics that were one part of the process.
Metrics one aspect of the budget reduction considerations
Per the UNL budget reduction process website, please note the quantitative metrics approach was combined with other qualitative assessments, such as strength of the program, needs of the state, and workforce alignment. Quantitative metrics are one aspect of consideration.Process and expertise in metrics development
The metrics analysis part of the UNL budget reduction process was conducted by a team of data analytic professionals, including with graduate-level education and decades of experience working with institutional instructional and research administration data at UNL and other AAU-level institutions. In the metrics development process, feedback was received from UNL campus leaders (Deans, College leadership and Department Executive Officers), as well as the Academic Planning Committee, in Spring 2025. The Academic Planning Committee has also had the opportunity to validate analyses in Fall 2025. At this late stage in the process, the metrics themselves won’t be changed.Access to data at the faculty level
As the Chancellor has stated at various points in the process, the detailed source system data underlying the metrics calculations cannot all be released in full, given the unprecedented size and complexity of these data. It is also not appropriate to release individual-level data to those beyond their home program or with individuals not holding a supervisory or administrative role with the faculty member’s department or college. Much of the raw data is available to Department Executive Officers for their unit, such as through NuRamp, Academic Analytics, PeopleSoft, Watermark’s Activity Insights, SAP or HR and financial systems necessary for the operation of a given unit.Academic Analytics Scholarly Research Index (SRI)
The SRI was generated for each academic program relative to other AAU public institutions. Importantly, the set of reference institutions for the budget exercise was decidedly other AAU public institutions, an aspirational peer group. This is not the same as the default in Academic Analytics, which is all like programs across institutions of higher education captured in Academic Analytics. The chart distributed at the Board of Regents meeting was SRI relative to all institutions of higher education.
The set of SRI scores across UNL academic programs was converted to Z-scores, as was the case for the other 17 instructional and research metrics included in the budget reduction process. While it is understood that the process of converting to Z-scores does not retain the interpretability of the original SRI for a given program, in terms of where it stands relative to like programs, it does retain the ordering across UNL programs (i.e., those with the highest SRIs relative to like programs will retain the highest Z-scores for this metric). This is a valid use of these data for the specific purpose of the UNL budget reduction metric analyses.
There was a suggestion to consider the SRI percentile rather than index score. While we cannot change the overall metrics at this late stage in the process, we did reanalyze the research metrics replacing SRI with SRI percentile using the AAU public institutions as the aspirational peer group. There is no significant change to the ranked quantitative assessment of programs when using SRI percentile rather than SRI, and there is no change to the departments that ranked in the bottom tier using the quantitative assessment.<stat department member’s> appointment
SAP is the official HR data system for the University of Nebraska, and the official record leveraged to generate faculty appointment data for the purposes of the UNL budget reduction process. As has been pointed out, <stat department member’s> appointment in that system has not accounted for a continued appointment in Statistics, along with <their> appointments in <unit 2> and <unit 3>. The IANR HR team has been made aware of this error and is correcting it. In response to Statistics Department concern about this matter, we have reviewed the department research calculations. While we cannot change the overall metrics at this late stage in the process, the changes to the research Z-score would have been .001 lower had <stat department member’s> appointment in SAP reflected a .2 FTE appointment in Statistics. Additionally, if the authorship on the <book>, had been split between <stat department member’s> and <stat department member’s>, the research Z-score would have been .01 lower.InCites access
We have confirmed that the University Libraries does not subscribe to InCites or any similar tool
A point-by-point response:
Per the UNL budget reduction process website, please note the quantitative metrics approach was combined with other qualitative assessments, such as strength of the program, needs of the state, and workforce alignment. Quantitative metrics are one aspect of consideration.
- The metrics list demand for the program being measured by student credit hours generated by majors. Statistics in particular has a strong program as evaluated by peer institutions (our 2021 APR particularly highlighted the undergraduate program, which is still only 3 years old and only has 2 years of data in the metrics analysis performed to eliminate our department). With respect to the needs of the state, Statistics is critical for statistical genetics, plant breeding, digital agriculture, AI, and data science. ALL of those fields are important to the Nebraska economy and workforce development.
- Departments are supposed to be presented with all of the evidence against them, so if qualitative factors were used, we should still have access to that information. We look forward to receiving the workforce development and Bureau of Labor Statistics reports.
The metrics analysis part of the UNL budget reduction process was conducted by a team of data analytic professionals, including with graduate-level education and decades of experience working with institutional instructional and research administration data at UNL and other AAU-level institutions.
- One of the reasons statisticians feel so strongly about the need for statistics training and programs is that “data analytic professionals” covers a wide range of skillsets, from “I can use Excel” to full-on hacker trained in shell scripting, R, python, and even assembly programming.
- Graduate level education in English or Music or Art isn’t going to help you do statistical analyses any better. An MBA might help with the aformentioned Excel skills, but it doesn’t provide the training to make sure that you don’t accidentally create a Cauchy random variable that does not have a finite mean or variance, and then standardize that variable by subtracting a calculated mean that has no relevance to the distribution and dividing by a standard deviation that also has no relevance to the distribution. Cauchy variables are interesting because you can take a sample from that distribution, calculate the mean of the sample, and the mean will never converge to anything because the underlying distribution has no mean. Statisticians use it as a counter-example in theoretical proofs, but it’s not touched on in Quantitative Psychology, Business Analytics, or other quantitative domain applications of statistics.
- Decades of experience working with institutional instructional and research administration data is frankly alarming, because if this type of analysis is done frequently, it suggests that the decisions guiding university administration might actually be as random as they appear from the outside.
- “at UNL and other AAU-level institutions” – please name the other AAU institutions, so that we can avoid applying there as we examine other opportunities during this unsettled time.
In the metrics development process, feedback was received from UNL campus leaders (Deans, College leadership and Department Executive Officers), as well as the Academic Planning Committee, in Spring 2025.
- We understand that more statistically informed members of the APC offered to help you develop better analyses in May, but they were refused access to the data and their opinions were ignored.
- Deans, College leadership, and Department Executive Officers do not necessarily have any more statistical expertise than anyone else on campus will if this proposal goes through.
- Providing the metrics without data makes it very difficult to determine what the underlying distributions of the data might be, which makes it hard to see the very real problems with the metric formulas. Continuing to not provide this data prevents the necessary and procedurally required ability for units to correct the metrics used to condemn them under this plan. We note that this process is supposed to be completed before the plan is made public.
The Academic Planning Committee has also had the opportunity to validate analyses in Fall 2025.
- Actually, the APC had the opportunity to verify the calculations, but they did not have access to the underlying data used to compute the values.
At this late stage in the process, the metrics themselves won’t be changed.
- We understand that it is inconvenient to change things after the plan has been publicly announced. It might be embarrassing to admit that data analysis mistakes were made.
- The APC process states that units must have the chance to correct the information used in the decision-making process. Departments have not been given access to the sources of qualitative information, individual information to verify the calculations (and indeed, we have found several issues in Statistics, only one of which was presented to the ORI), or the relative priorities of different factors (some sort of decision matrix, if one was used).
Information used in the reallocation and reduction process must be made available to the budget planning participants and affected programs in a timely manner so that corrections and explanations can be made before it is released to the public.
As the Chancellor has stated at various points in the process, the detailed source system data underlying the metrics calculations cannot all be released in full, given the unprecedented size and complexity of these data.
The data are not that large or that complex (at least to statisticians, biologists, and computer scientists). Statisticians deal with data that is far more complex on a daily or weekly basis, and biologists deal with terabytes of genetics data that is far more complicated than this type of tabular academic data.
When dealing with unprecedented data, it is usually helpful to get assistance from an expert who can guide you. The Statistics department would have been happy to help you. Academic Analytics might have been a valuable resource - they were quite helpful when we worked with them to understand the database and SRI calculations.
It is also not appropriate to release individual-level data to those beyond their home program or with individuals not holding a supervisory or administrative role with the faculty member’s department or college.
- Publications, Citations, Books, Articles, and Conference presentations are all public information, most of which can be acquired from our Google Scholar profiles. This is not a list of SSNs or bank account numbers.
Much of the raw data is available to Department Executive Officers for their unit, such as through NuRamp, Academic Analytics, PeopleSoft, Watermark’s Activity Insights, SAP or HR and financial systems necessary for the operation of a given unit.
It is important to document exactly how one would pull this information from these systems systematically, so that the analyses can be verified and repeated within a department. Given the confusion over headcount, you might appreciate how many different ways the university has to record effort, apportionment, budget contributions, and so on – disambiguating which measures were used is critically important.
As you are making employment decisions based on this data, and will be evaluating productivity based on it, it seems reasonable that you should provide reports to each faculty member on a monthly or an annual basis, detailing every piece of information you have on them, so that they can identify holes in this information. Similar automatic reports are sent out monthly w.r.t. budget expenditures, and if all of the data is in basic databases, automating these reports should be straightforward.
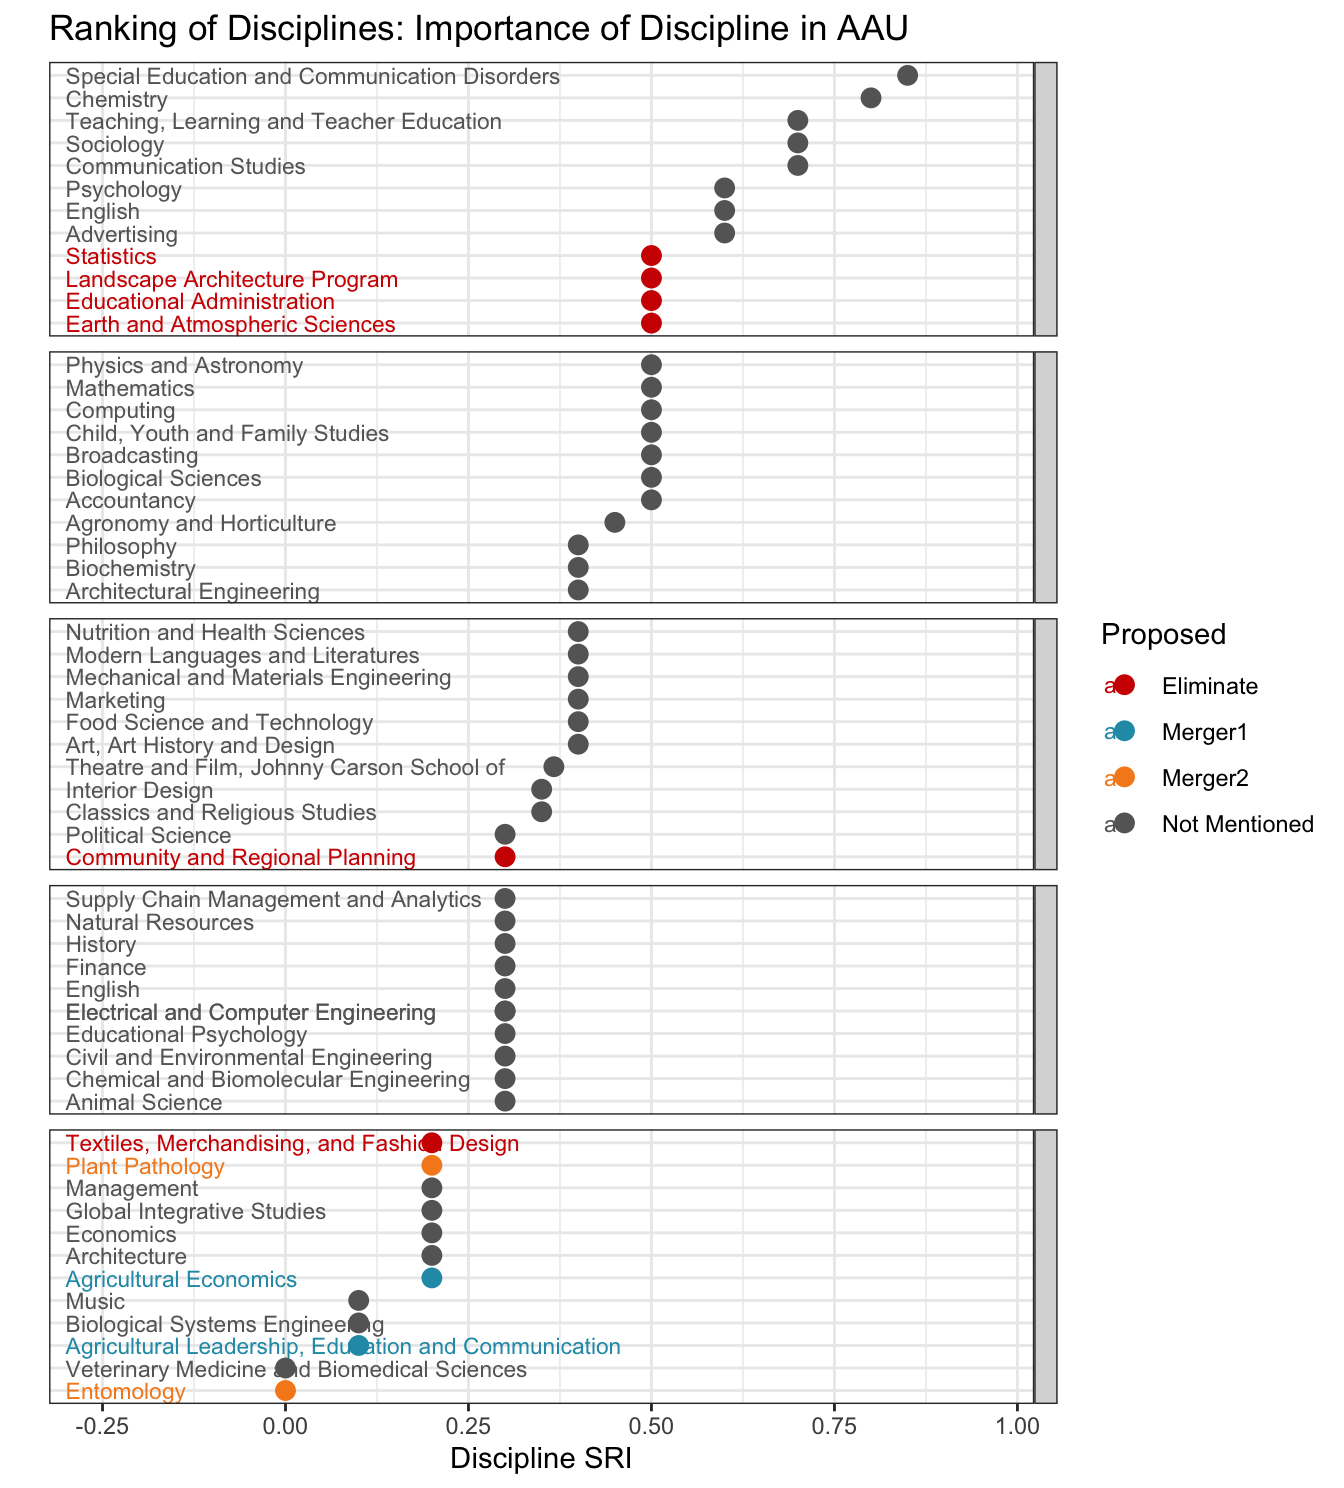
The SRI was generated for each academic program relative to other AAU public institutions. Importantly, the set of reference institutions for the budget exercise was decidedly other AAU public institutions, an aspirational peer group. This is not the same as the default in Academic Analytics, which is all like programs across institutions of higher education captured in Academic Analytics. The chart distributed at the Board of Regents meeting was SRI relative to all institutions of higher education.
We used SRI relative to all institutions precisely because of the lack of data access - while we could get data for other statistics departments and use that data to filter and create our rank among public AAU institutions, we could not do this for other departments. However, the SRI values remain the essentially the same, minus a discipline-specific penalty. The custom SRI values used represent a shift in the mean or median based on the comparison group, but this is easy to calculate when or if all of the data is available. In absence of that, however, it is still useful to show institutions based on the actual, not aspirational, comparison group of all universities tracked by Academic Analytics.
It is possible to actually determine which departments are more important to AAU institutions1 by examining the shift between the SRI and the custom SRI. Large shifts are indicative that AAU universities tend to have departments that are significantly better than non-AAU universities. In disciplines like Chemistry, this shift is greater than 0.75, while in Statistics it is 0.5 - both values indicate the relative importance of these departments within AAU universities. Based on this assessment, however, it is clear that UNL is cutting departments that might be important, as shown in Figure D.1.
The set of SRI scores across UNL academic programs was converted to Z-scores, as was the case for the other 17 instructional and research metrics included in the budget reduction process. While it is understood that the process of converting to Z scores does not retain the interpretability of the original SRI for a given program, in terms of where it stands relative to like programs, it does retain the ordering across UNL programs (i.e., those with the highest SRIs relative to like programs will retain the highest Z-scores for this metric).
- The analyst at Academic analytics disputed the validity of using Z-scores of SRI metrics for anything at all. In Table C.2, we show that different disciplines can have the same SRI and it can mean very different things – for instance, percentiles compared to other universities range between 92% (Ag & Hort) to 71% (ALEC) for the same SRI of 0.4. This represents a fundamental problem with taking z-scores of values across disciplines. Z-scores are only appropriate when the values originate from the same population, and Academic Analytics explicitly defines that population as departments in the same discipline.
This is a valid use of these data for the specific purpose of the UNL budget reduction metric analyses.
- This is only a valid use of these data for budget reduction metric analyses if you do not care about those analyses being accurate or reflecting the true performance of each department.
There was a suggestion to consider the SRI percentile rather than index score. While we cannot change the overall metrics at this late stage in the process, we did re-analyze the research metrics replacing SRI with SRI percentile using the AAU public institutions as the aspirational peer group. There is no significant change to the ranked quantitative assessment of programs when using SRI percentile rather than SRI, and there is no change to the departments that ranked in the bottom tier using the quantitative assessment.
- Interestingly, it would be difficult to compute the SRI percentile using AAU public institutions as the peer group, given that UNL is not an AAU public university – therefore by definition it is out of distribution and cannot be ranked. However, ignoring that little quibble, you still have not provided enough information to determine whether the calculations were done correctly - for instance, did you create a z-score of the percentiles, or use the inverse distribution function to directly get a z-score for the department compared to its peers? Without knowing how this was done, we cannot validate the method or the conclusions you came to. Precise definitions are incredibly important to reproducibility.
SAP is the official HR data system for the University of Nebraska, and the official record leveraged to generate faculty appointment data for the purposes of the UNL budget reduction process. As has been pointed out, <stat department member’s> appointment in that system has not accounted for a continued appointment in Statistics, along with <their> appointments in <unit2> and the <unit3>. The IANR HR team has been made aware of this error and is correcting it.
We are glad the error is being corrected, as <stat department member> has been a voting member of our department since their arrival at UNL. However, it is also important that departments are given the opportunity to correct their data before the plan to eliminate the department is made public. This did not happen.
In fact, we have spent the last 2 weeks scrambling to even identify the issues with the data and the metrics, and have only managed to do so in spite of obfuscation and denials from ORI and the executive leadership team. In every case, we have made an attempt to correct the issues in private before going public with the problems – after all, Statistics exists as a resource for other departments, and we have helped Community and Regional Planning, Educational Administration, Earth & Atmospheric Sciences, and Textiles, Merchandising, and Fashion Development with determining whether the issues we have found apply to them as well. We showed that the AcA comparison group for TMFD was incorrect and rendered the SRI data effectively useless (as well as the derived percentiles, ranks, etc.) because the comparison group was too broad – which is an issue that Academic Analytics cautions about in their documentation.
In certain disciplines ??? especially the arts and humanities ??? there are forms of faculty scholarly activity that are not captured in the Academic Analytics database. These include residencies, exhibitions, and performances, as well as the research underpinning these activities.
When indices of research activity are employed, the components are weighted appropriately using discipline-specific measurements derived from nationally recognized sources.
- Errors in the e.g. comparison group for TMFD are impactful, and it is clear from Academic Analytics that the institution is responsible for choosing the correct comparison group CIP code. Thus, since the instition is responsible for this, it should also be responsible for carefully validating the comparison group, whether there are sufficient comparison departments, etc. It is clear that this validation process was either not performed or was not effective.
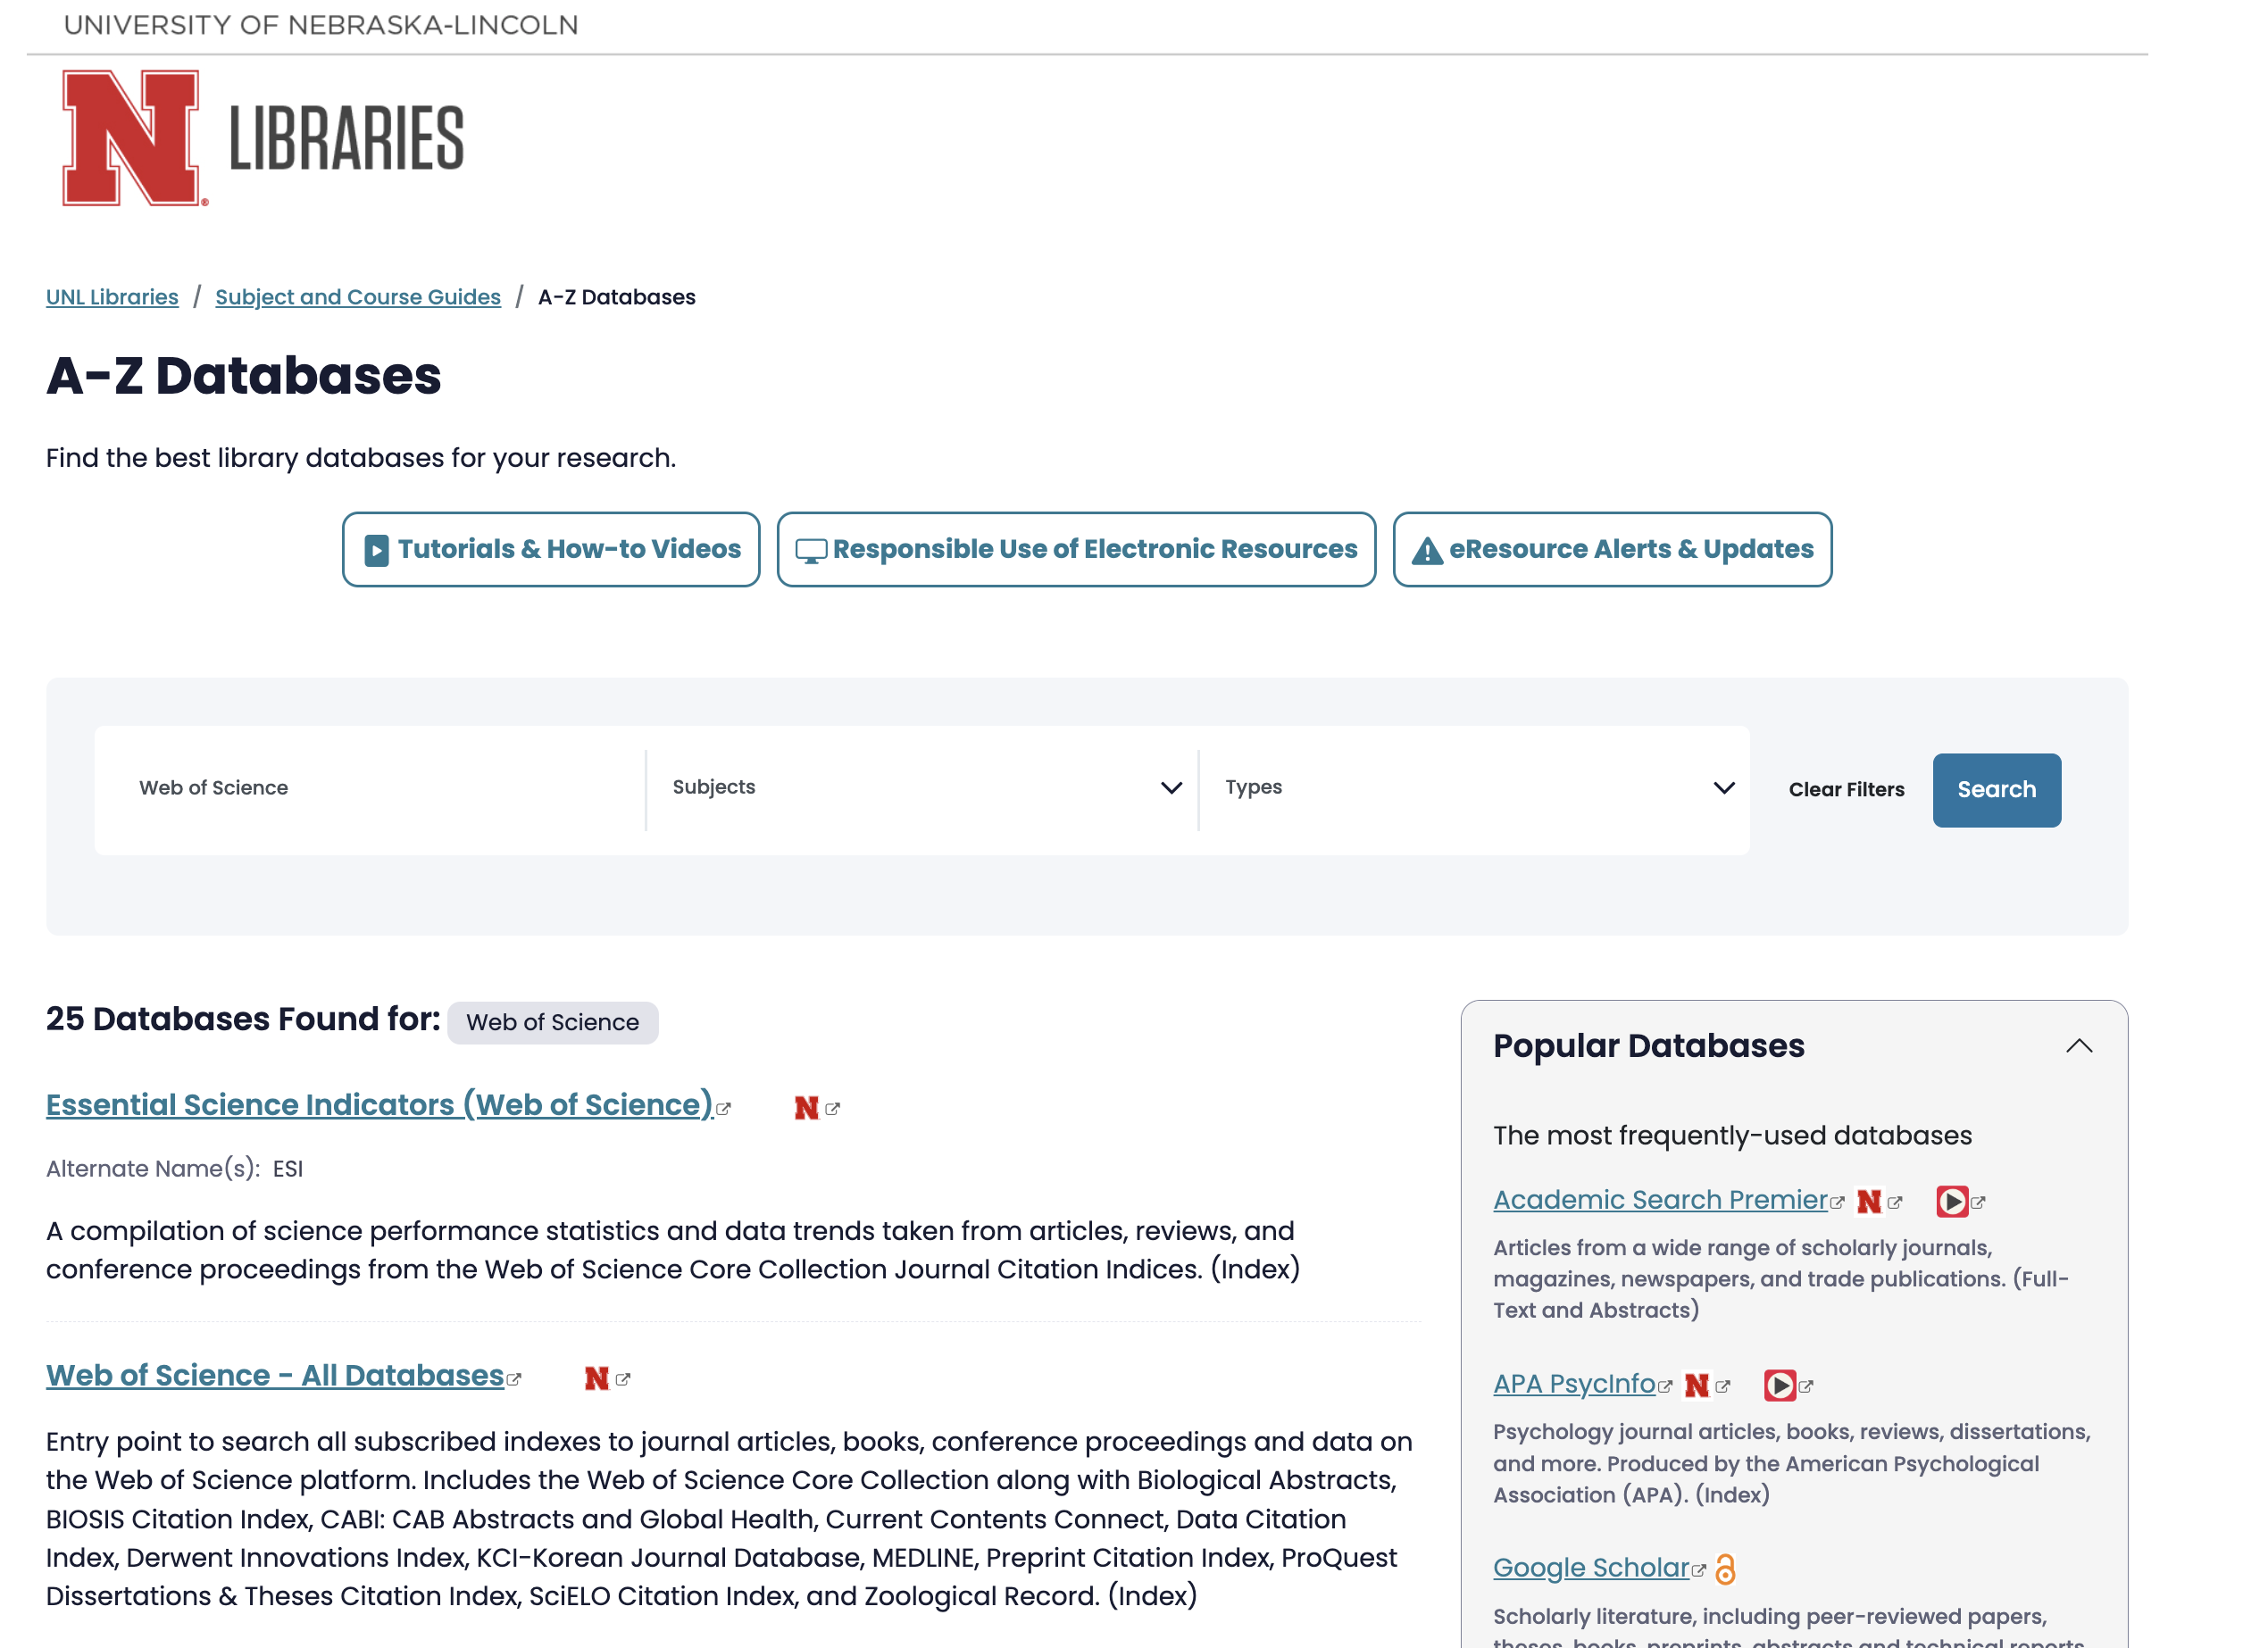
We have confirmed that the University Libraries does not subscribe to InCites or any similar tool.
Well, that shows the care with which other validation procedures might have been performed.
InCites uses Web of Science as the underlying database (as described in InCites’ documentation and marketing materials), and UNL Libraries provides individual level access to Web of Science databases, as shown in Figure D.2.
Presumably, with some error bars relative to the size of the comparison group, but again, we cannot access the data needed to estimate this.↩︎