Susan Vanderplas
About
More
Publications
Teaching
Talks
Other
Current Activities
Research, Talks, and Other Shenanigans
Categories
All
(83)
other
(6)
papers
(36)
post
(5)
talks
(41)
Order By
Default
Title
Date - Oldest
Date - Newest
Author
Having Your Cake and Eating It Too
post
other
I’ve been officially off-contract at UNL for almost four weeks. In that time, I’ve packed up most of my house, read about 30 novels
1
, bought a house, created a strategy to…
Jun 11, 2026
Susan Vanderplas
Faculty Are Not Widgets and Shouldn’t Work For Free
post
other
In the last few days, I’ve finished my final lecture at UNL, completed a pile of grading, submitted a subaward in a new collaboration (with people I met as a result of the…
May 6, 2026
Susan Vanderplas
On Fighting the Good Fight
post
other
It’s taken me a month and a few days to be ready to write this post, but I’m going to start with a conversation I had with my son on December 5th as we walked to the NU…
Jan 9, 2026
Susan Vanderplas
Program Cuts and The Yo-Yo of Hope and Despair
post
other
This is definitely not told in linear order from start to finish – for one thing, between Sept 11 and Dec 5, time itself lost all meaning for me. I was working about 3x…
Dec 3, 2025
Susan Vanderplas
Experimenting With AI as UNL Closes Departments
post
other
Today is the last day that UNL is allowing public comments about program closures, so I’ve been having a bit of fun shitposting comments on behalf of the departments…
Oct 13, 2025
Susan Vanderplas
Automated Residual Plot Assessment With the R Package autovi and the Shiny Application autovi.web
papers
Visual assessment of residual plots is a common approach for diagnosing linear models, but it relies on manual evaluation, which does not scale well and can lead to…
Oct 9, 2025
Weihao Li, Dianne Cook, Emi Tanaka, Susan Vanderplas, Klaus Ackermann
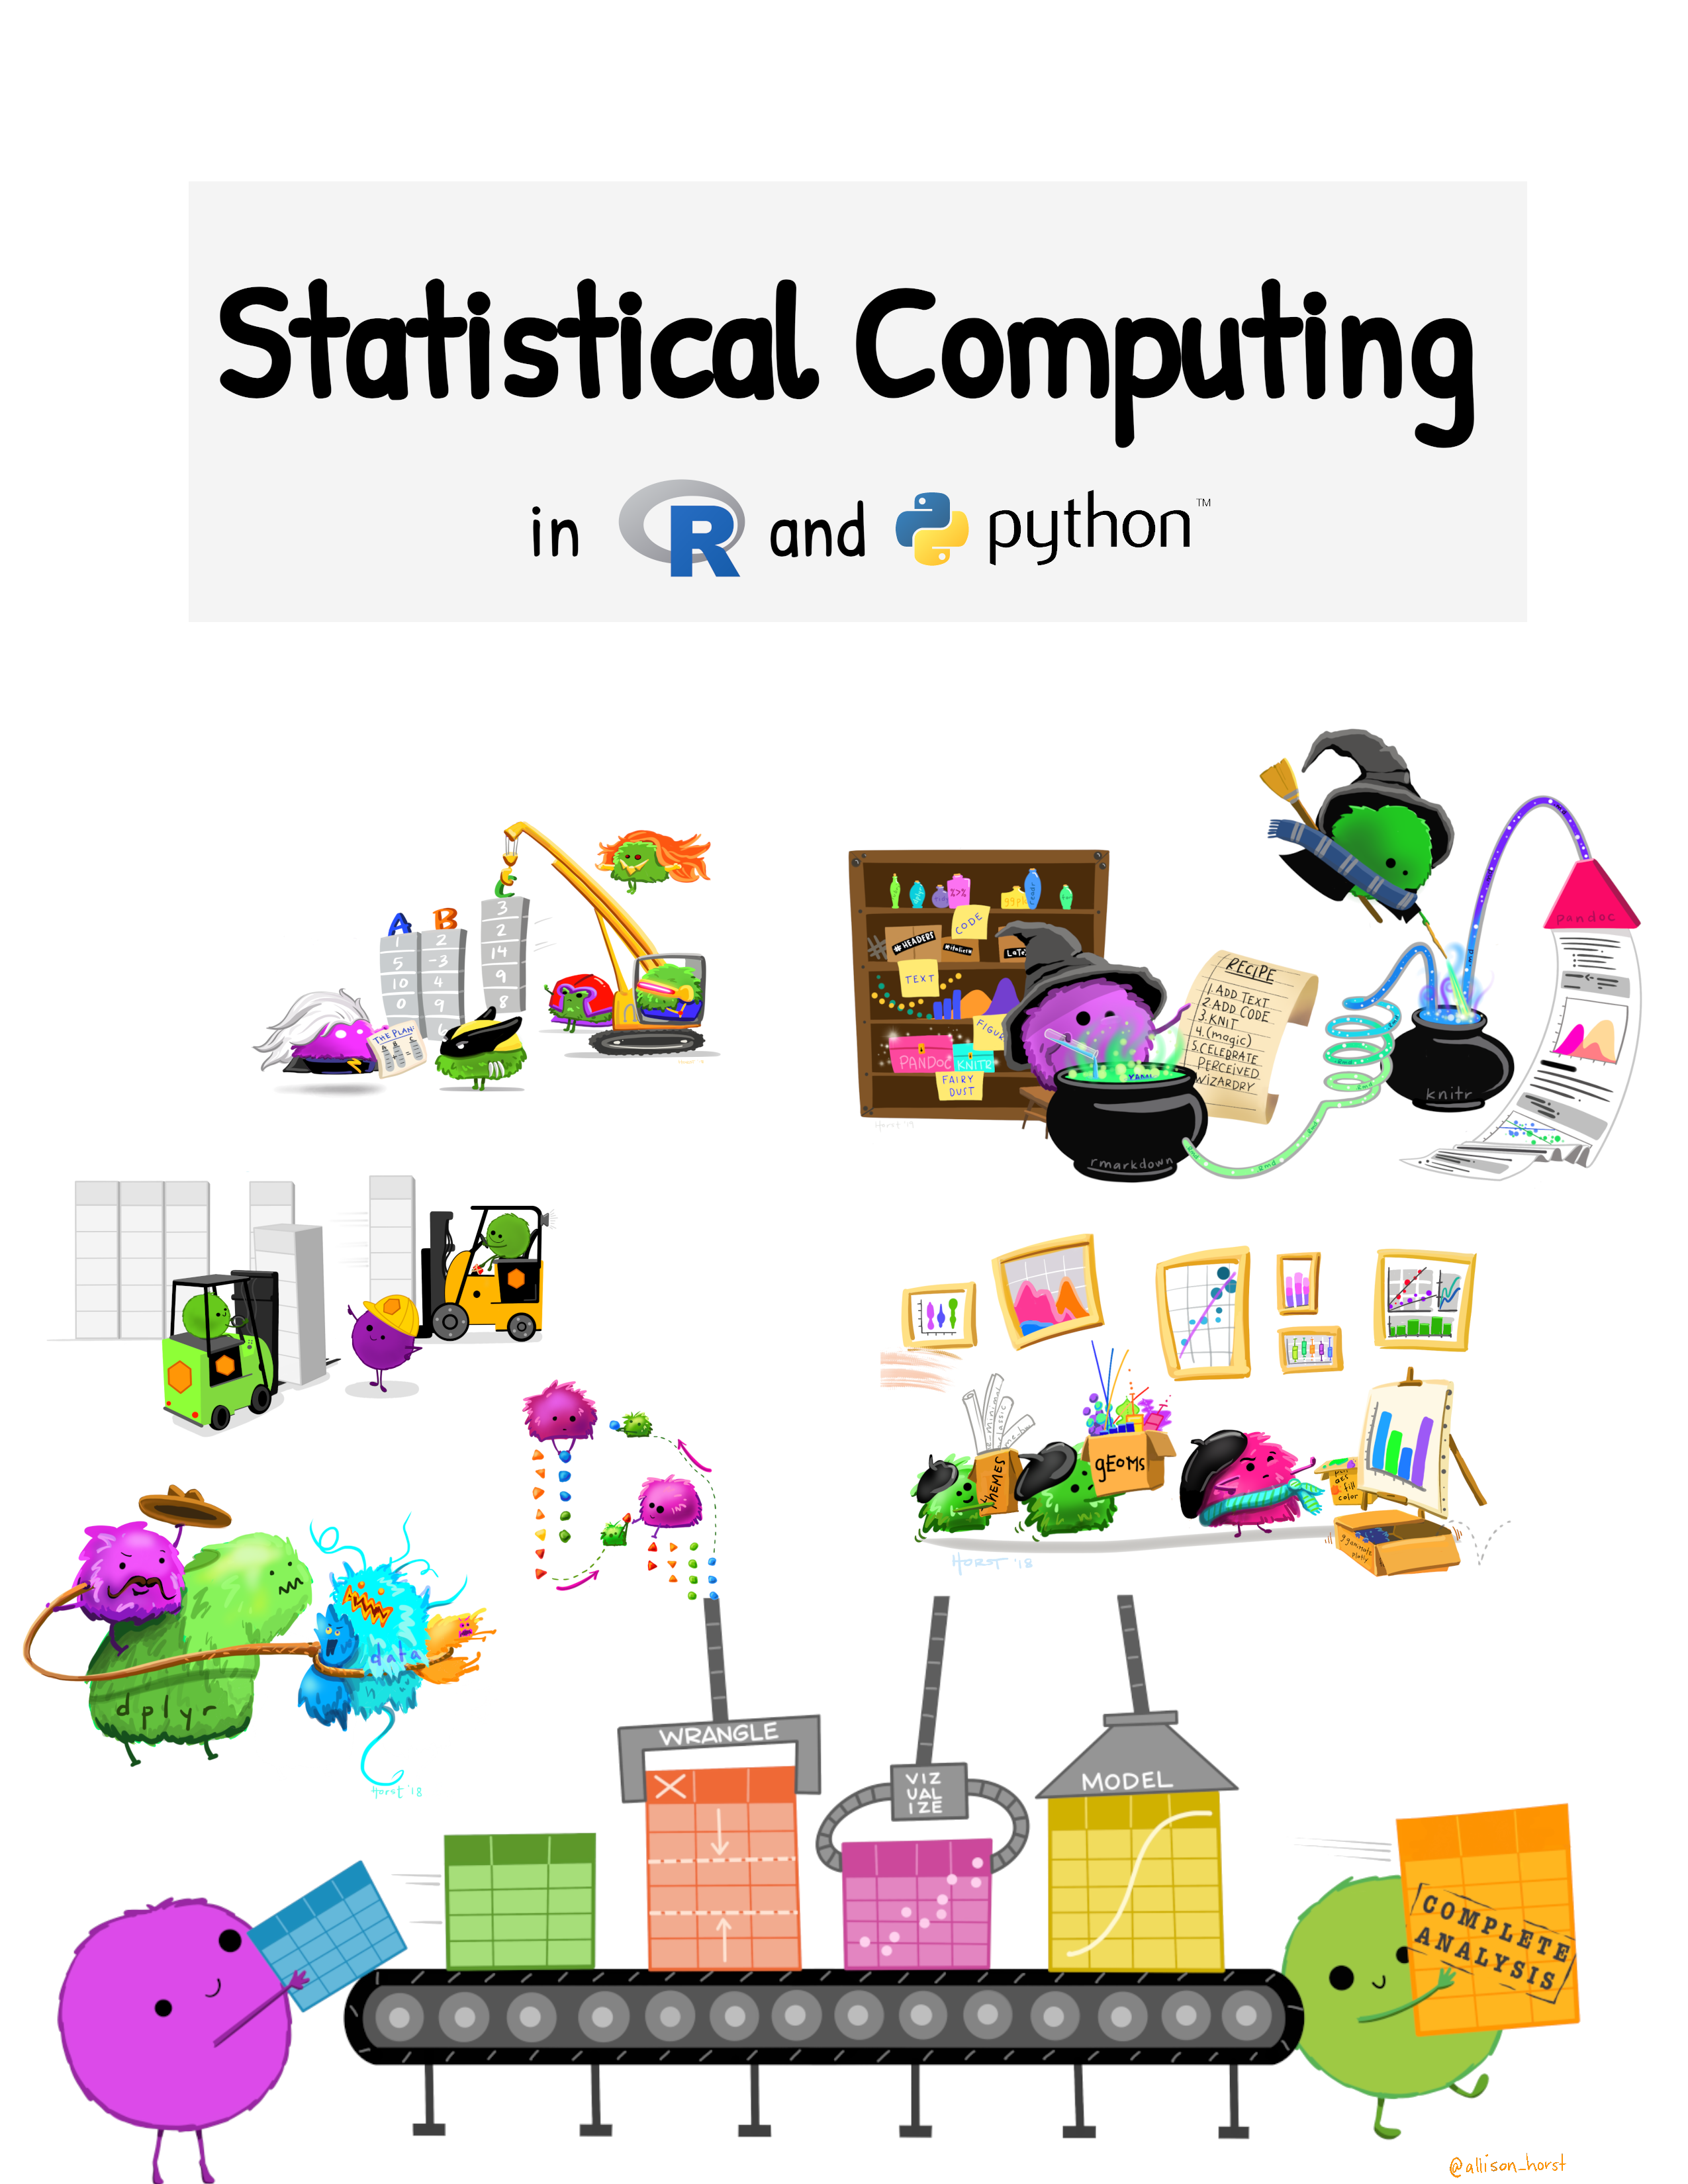
Teaching Statistical Computing with R and Python
talks
Computing courses can be daunting for students for a variety of reasons, including programming anxiety, difficulty learning a programming language in a second language, and…
Aug 9, 2025
Susan Vanderplas
Hidden Multiple Comparisons Increase Forensic Error Rates
talks
When wires are cut, the tool produces striations on the cut surface; as in other forms of forensic analysis, these striation marks are used to connect the evidence to the…
Aug 4, 2025
Susan Vanderplas
A Guide to Designing Experiments to Test Statistical Graphics
papers
In this paper, we discuss considerations and methods for experimentally testing visualizations. We discuss levels of user engagement with graphics, common issues when…
Jul 17, 2025
Emily Robinson, Heike Hofmann, Susan Vanderplas
Can You See The Change? Visual Perception in Change Point Analysis
papers
Detecting change points is crucial in analyzing time series data and single-subject designs. This study investigates factors influencing change point detection through…
Apr 1, 2025
Miguel Antonio Fudolig, Emily A. Robinson, Susan Vanderplas
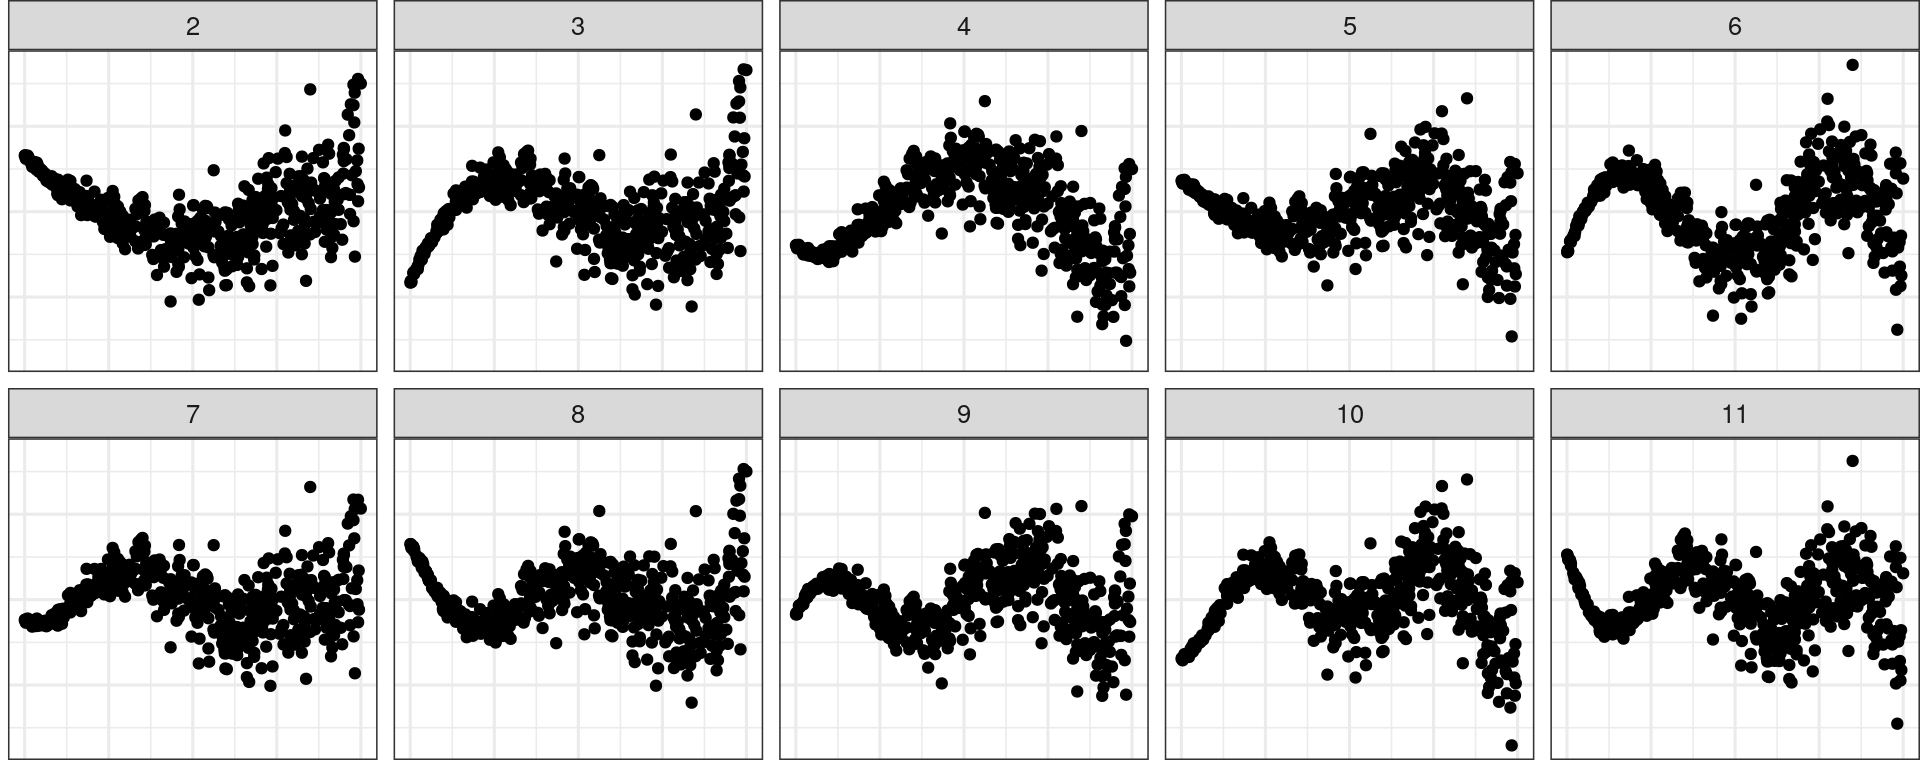
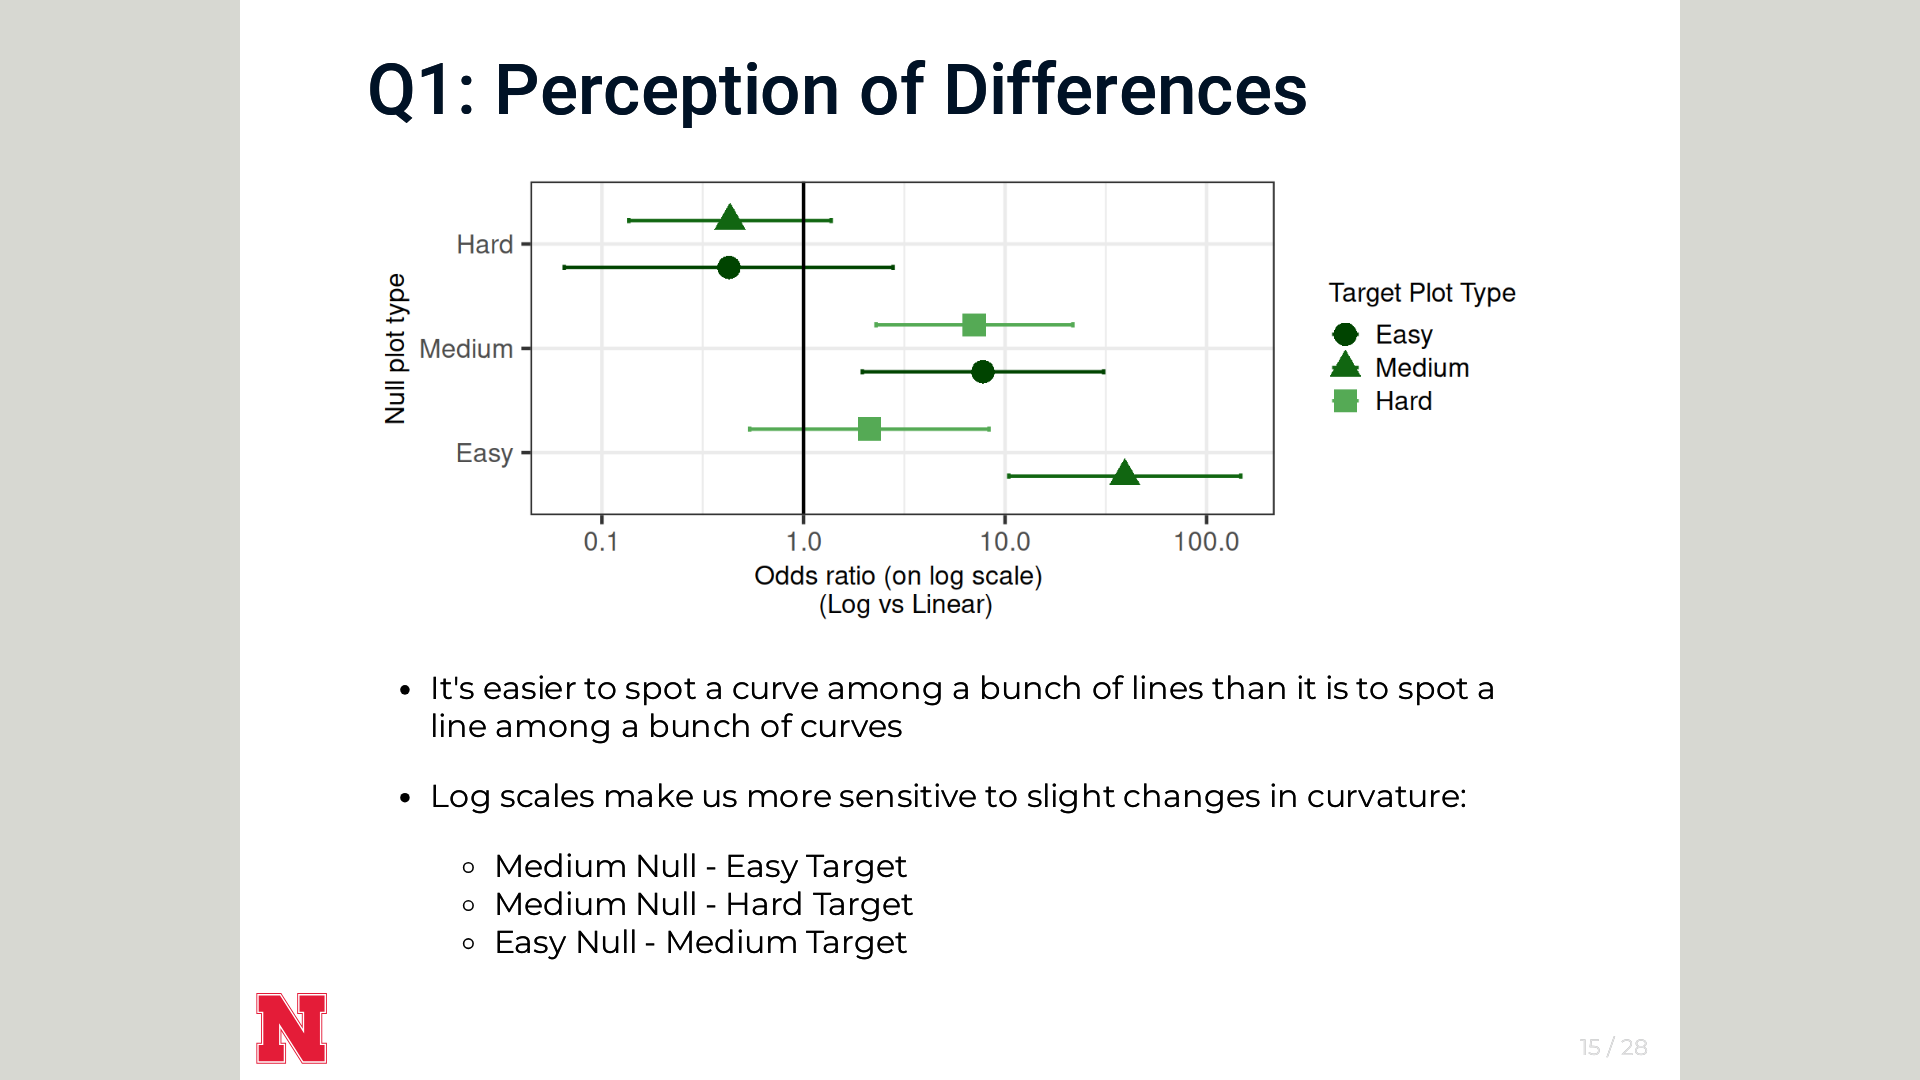
Perception and Cognitive Implications of Logarithmic Scales for Exponentially Increasing Data: Perceptual Sensitivity Tested with Statistical Lineups
papers
[1] E. A. Robinson, R. Howard, and S. Vanderplas. “Perception and Cognitive Implications of Logarithmic Scales for Exponentially Increasing Data: Perceptual Sensitivity…
Mar 11, 2025
Emily A. Robinson, Reka Howard, Susan Vanderplas
Methodological problems in every black-box study of forensic firearm comparisons
papers
[1] M. Cuellar, S. Vanderplas, A. Luby, et al. “Methodological problems in every black-box study of forensic firearm comparisons”. In:
Law, Probability and Risk
23.1…
Dec 5, 2024
Maria Cuellar, Susan Vanderplas, Amanda Luby, Michael Rosenblum
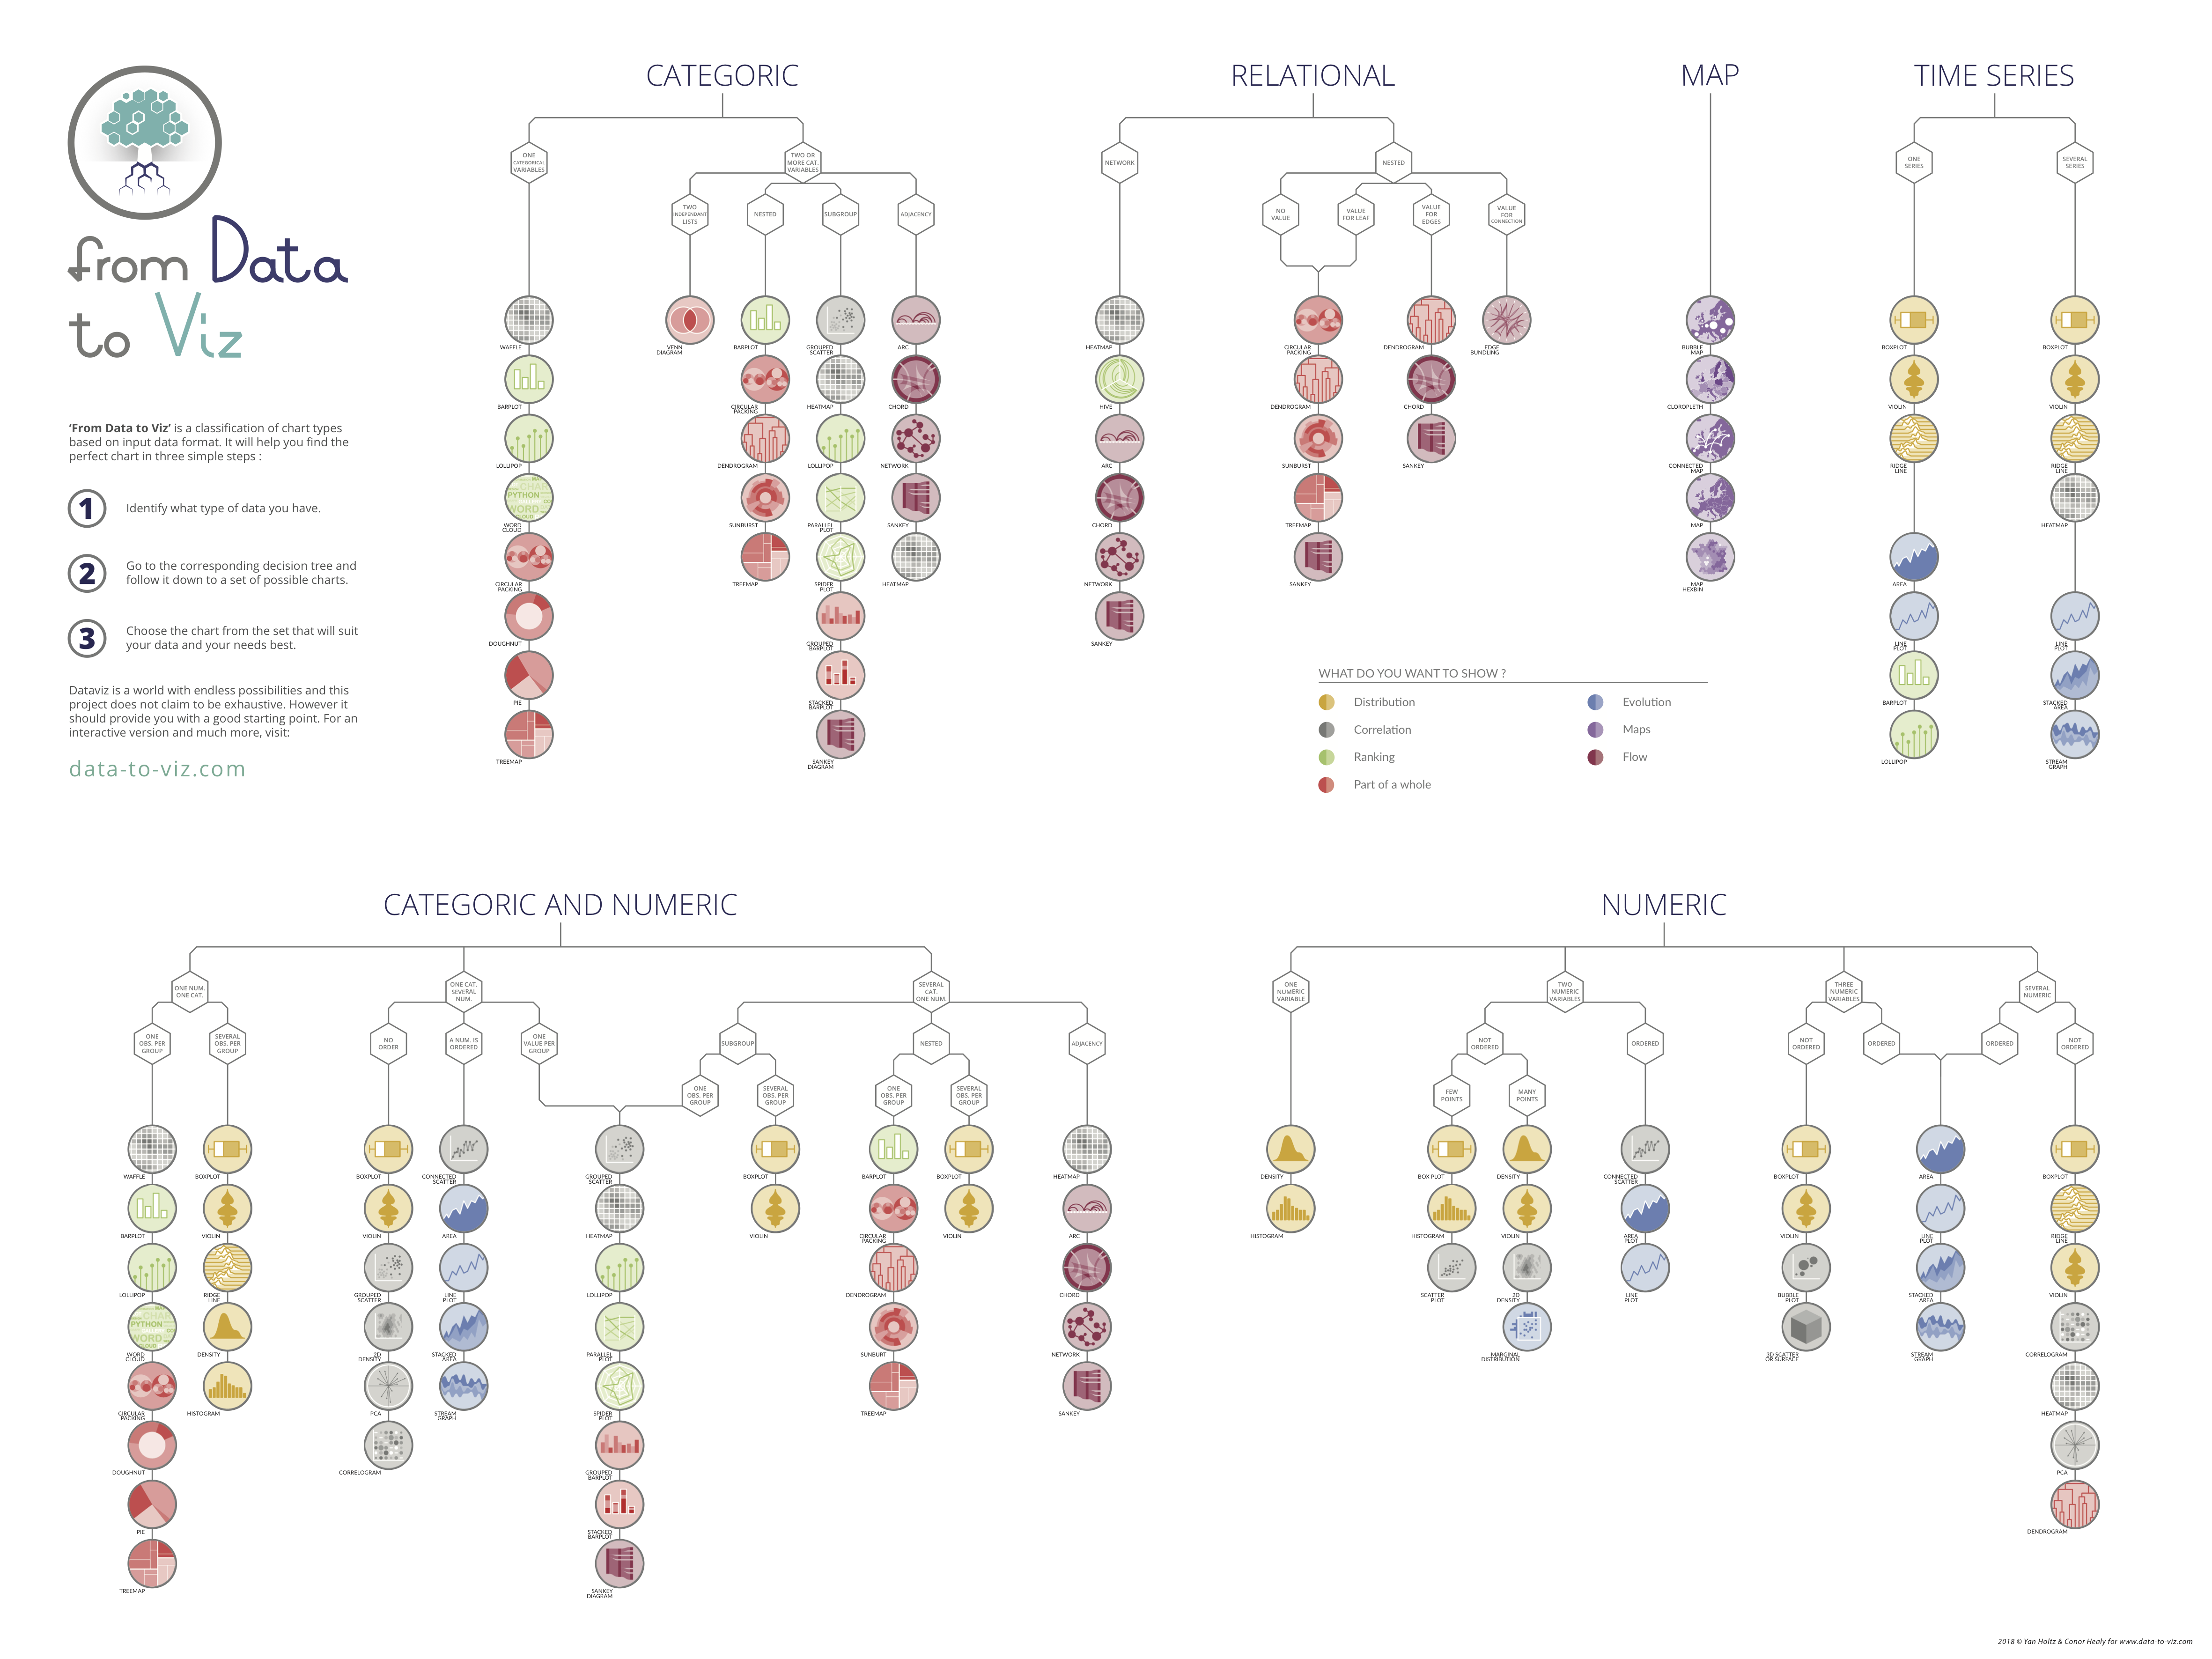
Creating Effective Graphics
talks
How do we create effective charts and graphs for scientific presentations? What are the elements of effective charts and graphics? Which charts should be used for different…
Nov 13, 2024
Susan Vanderplas
Incorrect statistical reasoning in Guyll et al. leads to biased claims about strength of forensic evidence
papers
[1] M. Rosenblum, E. T. Chin, E. L. Ogburn, et al. “Incorrect statistical reasoning in Guyll et al. leads to biased claims about strength of forensic evidence”. In:
Proceedin…
Nov 5, 2024
Michael Rosenblum, Elizabeth T. Chin, Elizabeth L. Ogburn, Akihiko Nishimura, Daniel Westreich, Abhirup Datta, Susan Vanderplas, Maria Cuellar, William C. Thompson
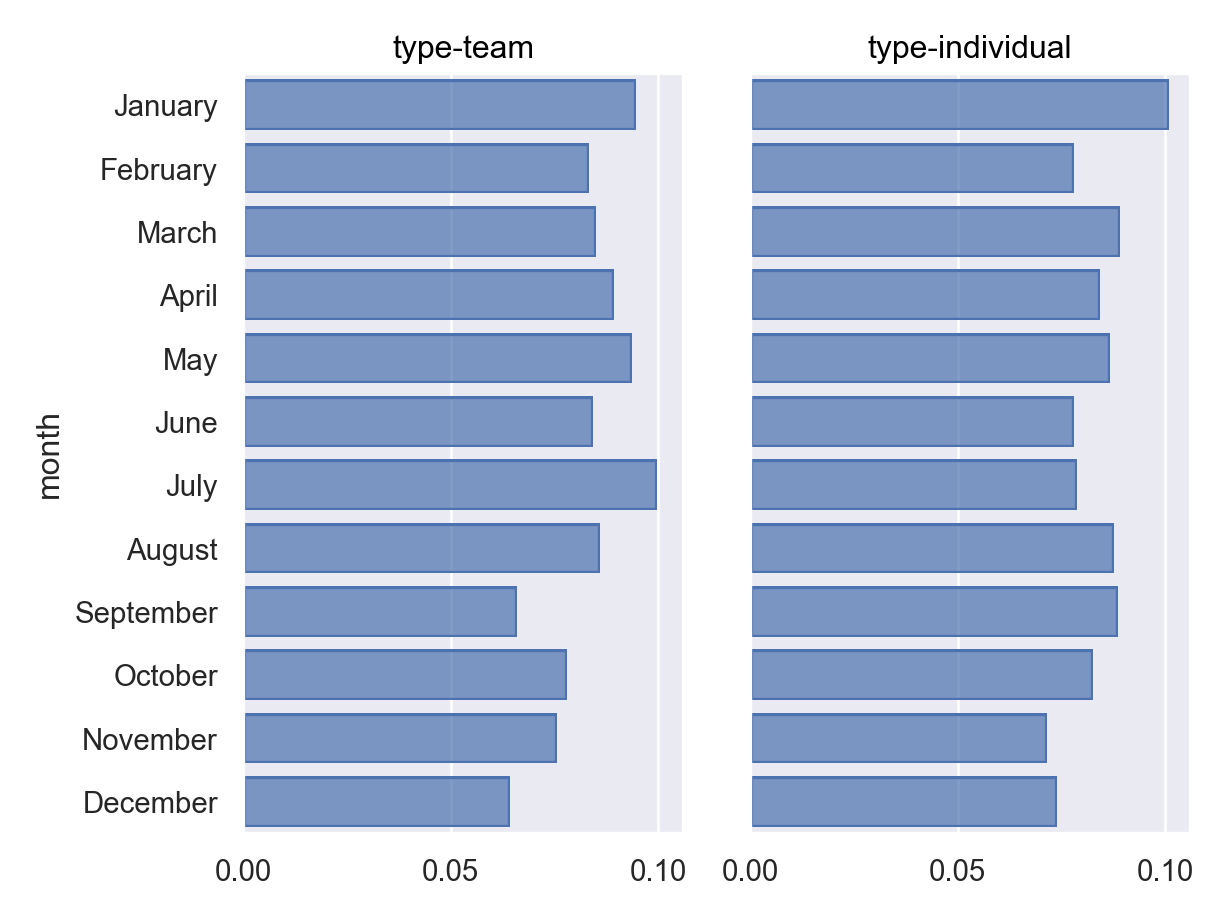
Web Scraping Olympics: Python
talks
A comparison of Python, Julia, and R for web-scraping Olympic athlete names, events, and birthdays. I represented python. See the full narrative here…
Nov 2, 2024
Susan Vanderplas
A Plot is Worth a Thousand Tests: Assessing Residual Diagnostics with the Lineup Protocol
talks
Regression experts consistently recommend plotting residuals for model diagnosis, despite the availability of many numerical hypothesis test procedures designed to use…
Aug 7, 2024
Weihao (Patrick) Li, Di Cook, Emi Tanaka, Klaus Ackermann, Susan Vanderplas
Escaping Flatland: Graphics, Dimensionality, and Human Perception
talks
Almost 40 years ago, Cleveland & McGill published the first of 3 papers detailing experiments assessing the accuracy of numerical perception using different types of charts.…
Jul 1, 2024
Susan Vanderplas
Escaping Flatland: Graphics, Dimensionality, andHuman Perception
papers
Almost 40~years ago, Cleveland and McGill published the first of 3 papers detailing experiments assessing the accuracy of numerical perception using different types of…
Jul 1, 2024
Susan Vanderplas, Erin Blankenship, Tyler Wiederich
Creating Good Graphics
talks
Let’s talk about how to create good charts and graphics!
Jun 26, 2024
Susan Vanderplas
Hidden Multiple Comparisons Increase Forensic Error Rates
papers
When wires are cut, the tool produces striations on the cut surface; as in other forms of forensic analysis, these striation marks are used to connect the evidence to the…
Jun 10, 2024
Susan Vanderplas, Alicia Carriquiry, Heike Hofmann
A Plot Is Worth a Thousand Tests: Assessing Residual Diagnostics with the Lineup Protocol
papers
Regression experts consistently recommend plotting residuals for model diagnosis, despite the availability of many numerical hypothesis test procedures designed to use…
May 22, 2024
Weihao Li, Dianne Cook, Emi Tanaka, Susan VanderPlas
Demonstrative Evidence and the Use of Algorithms in Jury Trials
papers
We investigate how the use of bullet comparison algorithms and demonstrative evidence may affect juror perceptions of reliability, credibility, and understanding of expert…
May 2, 2024
Rachel Rogers, Susan VanderPlas
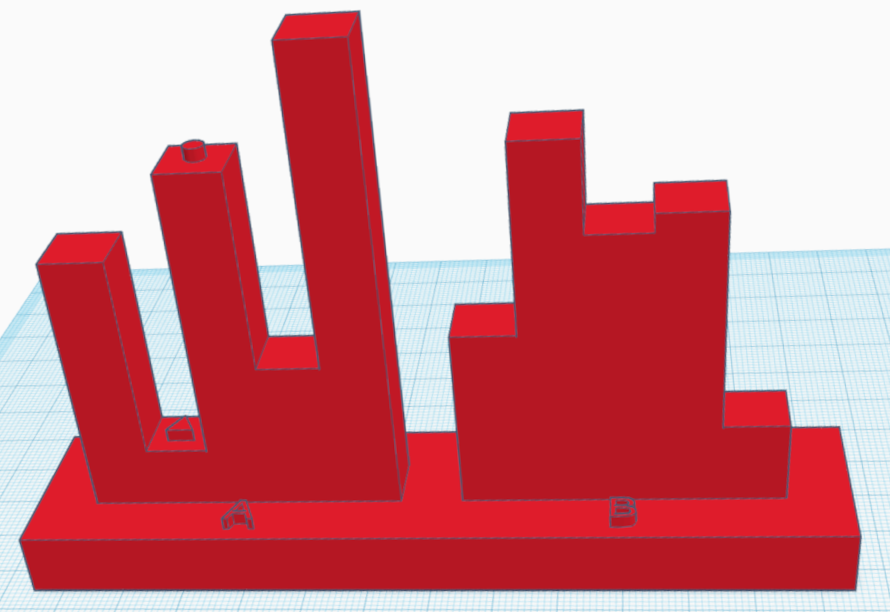
Evaluating Perceptual Judgements on 3D Printed Bar Charts
papers
Graphical design principles typically recommend minimizing the dimensionality of a visualization - for instance, using only 2 dimensions for bar charts rather than providing…
Apr 24, 2024
Tyler Wiederich, Susan Vanderplas
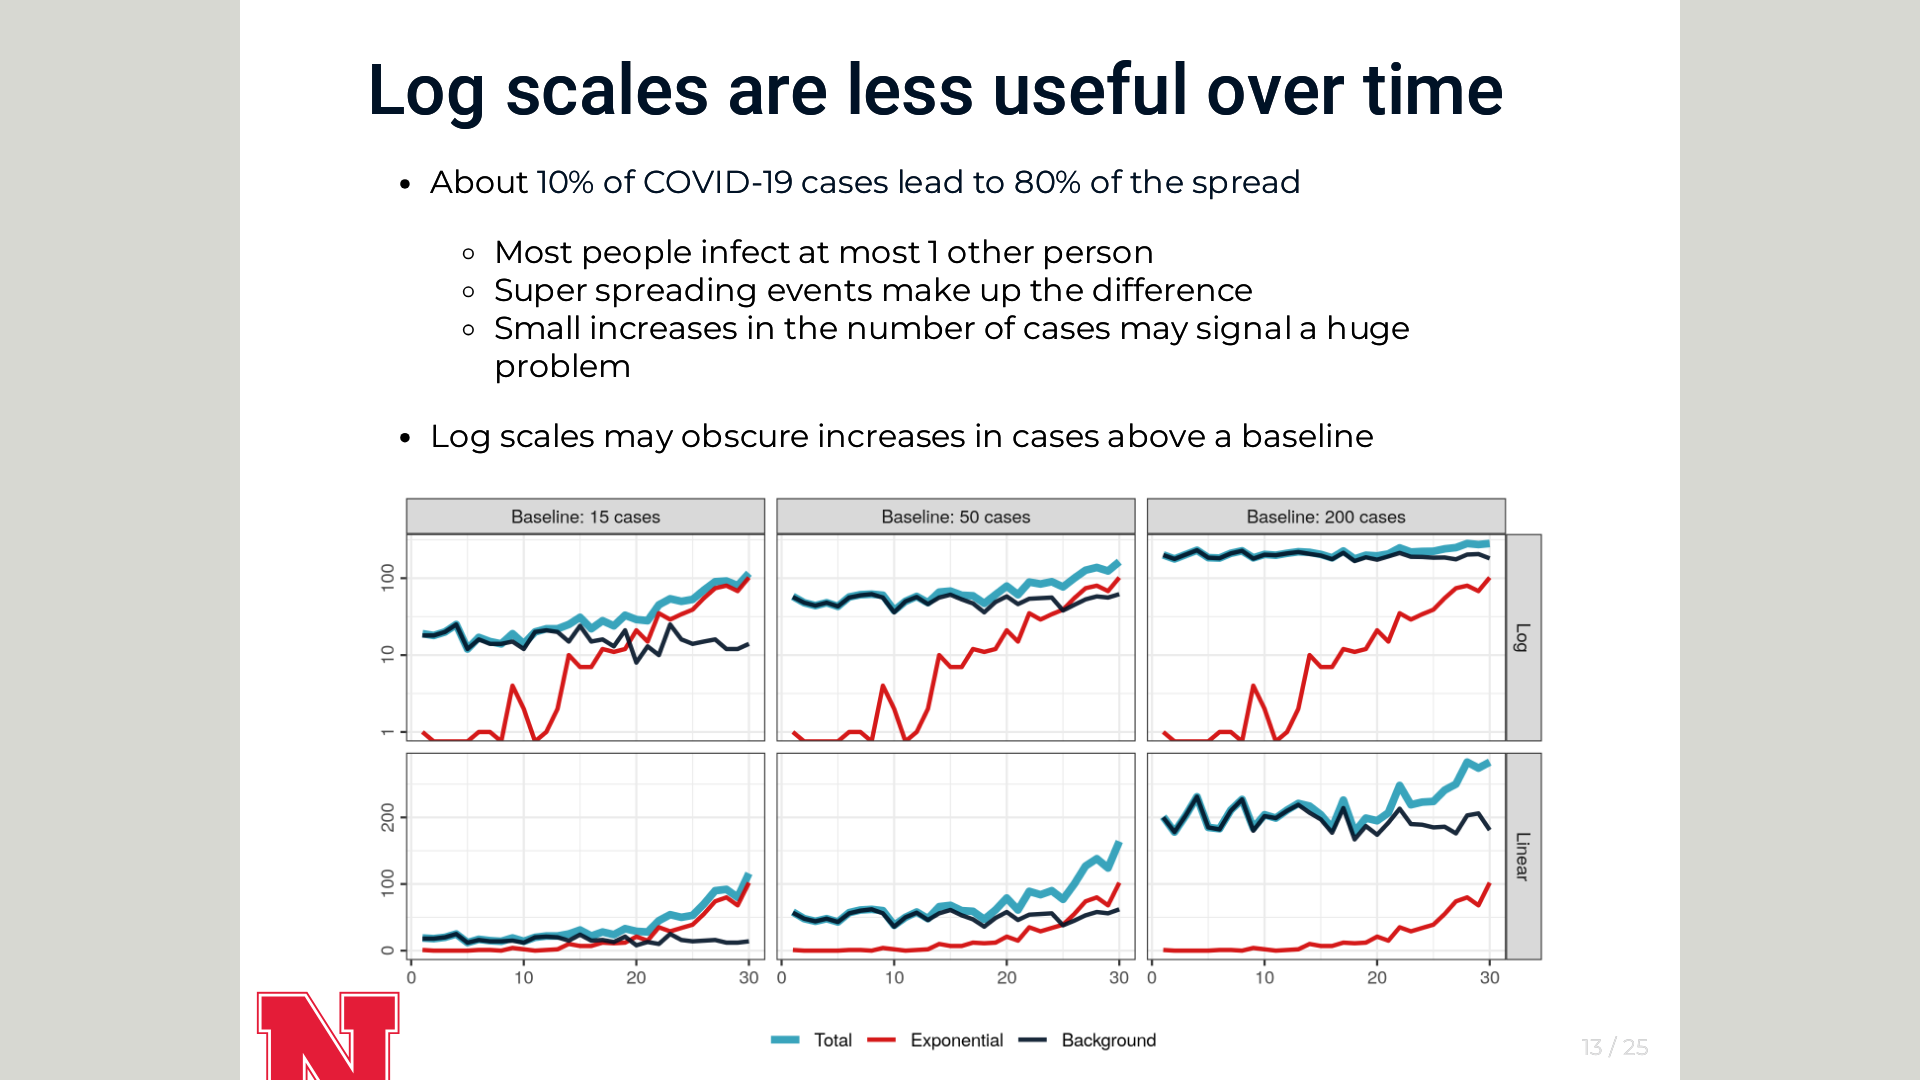
Graphical Perception in a Pandemic: Log Scales, Exponential Growth, and the Importance of User Testing
talks
During COVID, people all over the world were consulting time-series charts on a daily basis and using these charts to make decisions. Discussions broke out among data…
Mar 29, 2024
Susan Vanderplas, Emily Robinson, Reka Howard
Building a CV/Blog Automatically
talks
This week will be the second of a 2-part workshop. On Feb 15, we talked about how to make a CV with R and a google spreadsheet (and why you might want to do so). This week…
Mar 7, 2024
Susan Vanderplas
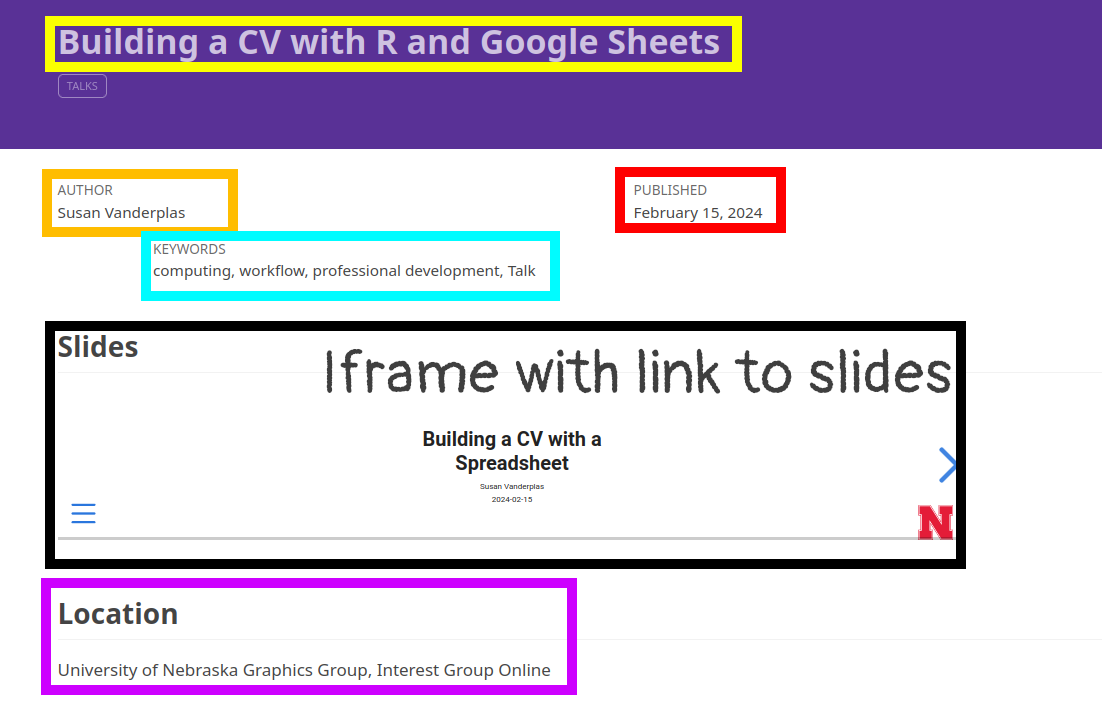
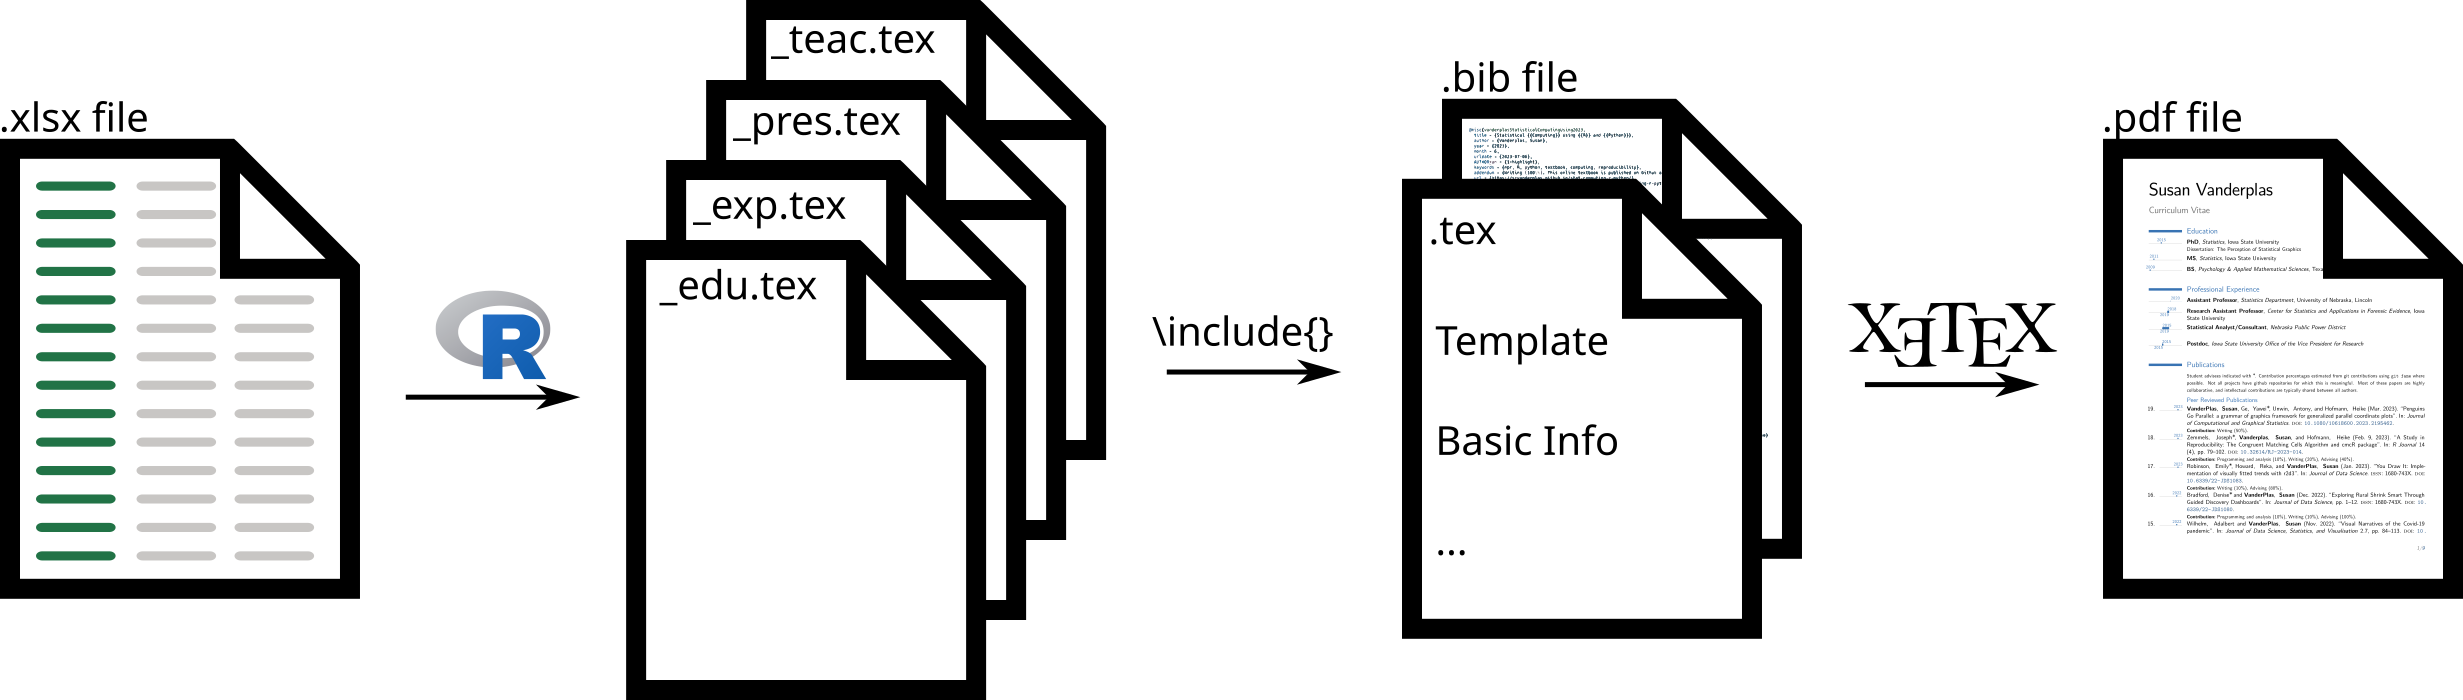
Building a CV with R and Google Sheets
talks
This week will be the first of a 2-part workshop. First, we’ll talk about how to make a CV with R and a google spreadsheet (and why you might want to do so). On March 7…
Feb 15, 2024
Susan Vanderplas
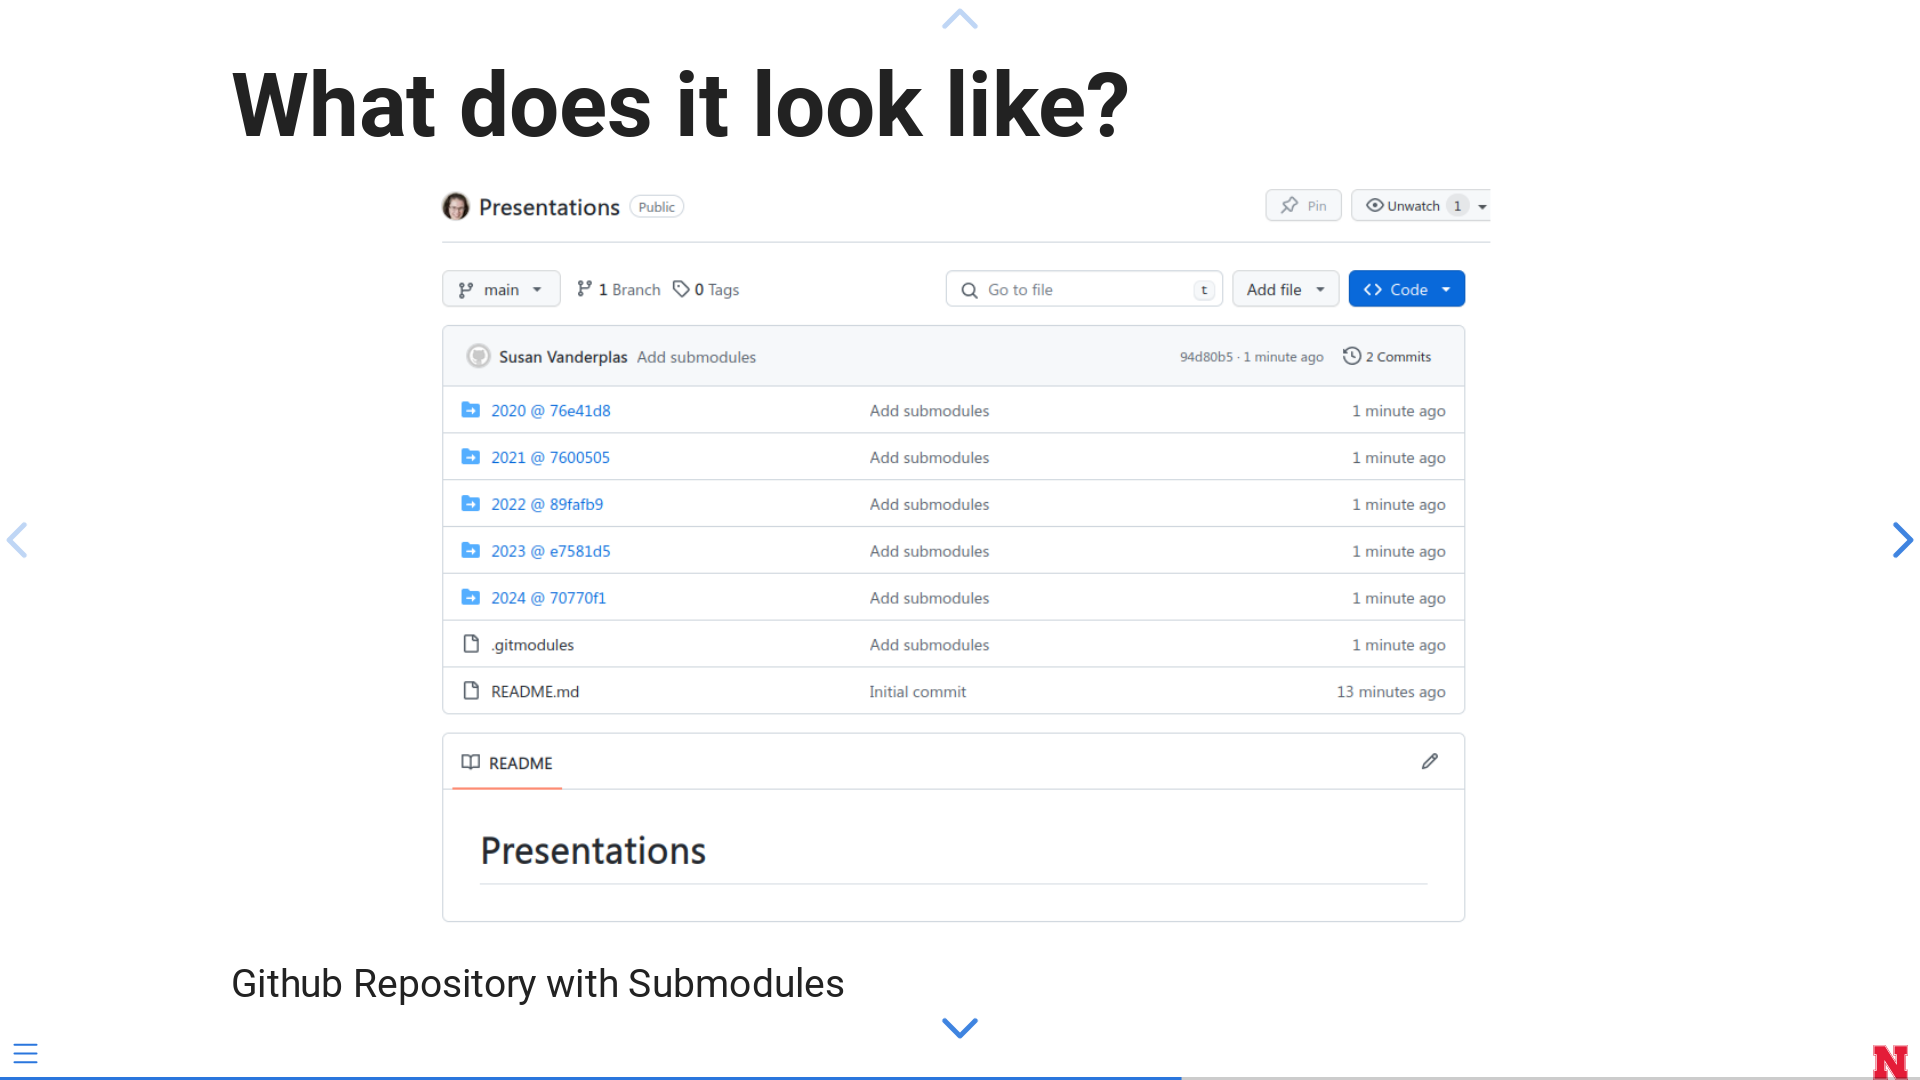
Using Git Submodules
talks
Sometimes, we want to have git repositories that are nested within each other, but git doesn’t allow us to do that. Instead, there are git submodules! I’ll talk about how…
Feb 8, 2024
Susan Vanderplas
One Model That Fits Them All: Psychometrics With Generalized Linear Mixed Effects Models
papers
User experiments are essential for informing researchers what an audience is seeing in a chart. User experiments are generally quite expensive in monetary value and in the…
Jan 24, 2024
Wangqian Ju, Susan VanderPlas, Heike Hofmann
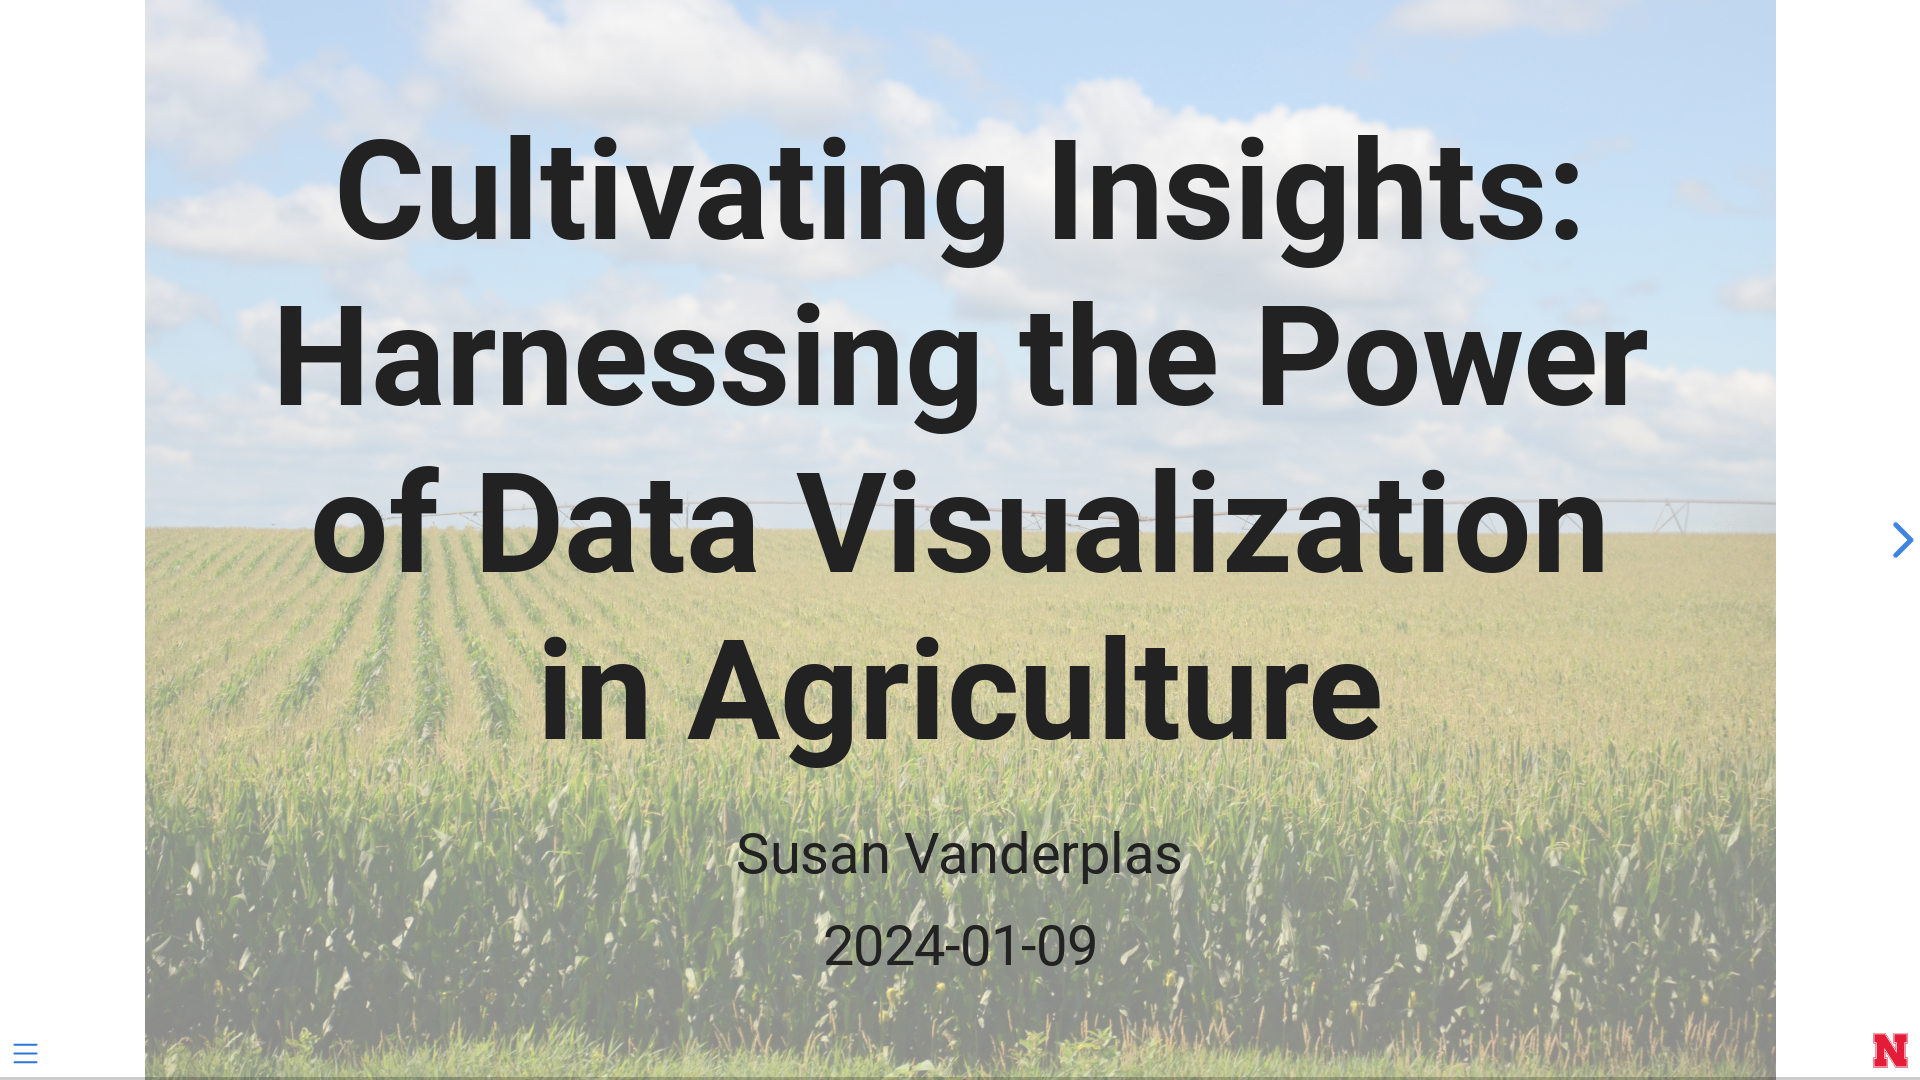
Cultivating Insights: Harnessing the Power of Data Visualization in Agriculture
talks
Data visualization is an important tool for examining the results of on-farm experiments before, during, and after formal modeling. This talk shows the different types of…
Jan 9, 2024
Susan Vanderplas
Misuse of statistical method results in highly biased interpretation of forensic evidence in Guyll et al. 2023
papers
[1] M. Rosenblum, E. T. Chin, E. L. Ogburn, et al. “Misuse of statistical method results in highly biased interpretation of forensic evidence in Guyll et al. (2023)”. In:
Law…
Jan 9, 2024
Michael Rosenblum, Elizabeth T Chin, Elizabeth L Ogburn, Akihiko Nishimura, Daniel Westreich, Abhirup Datta, Susan Vanderplas, Maria Cuellar, William C Thompson
Multimodal User Testing: Producing comprehensive, task-focused guidelines for chart design
talks
NA
Dec 14, 2023
Susan Vanderplas, Reka Howard, Emily Robinson
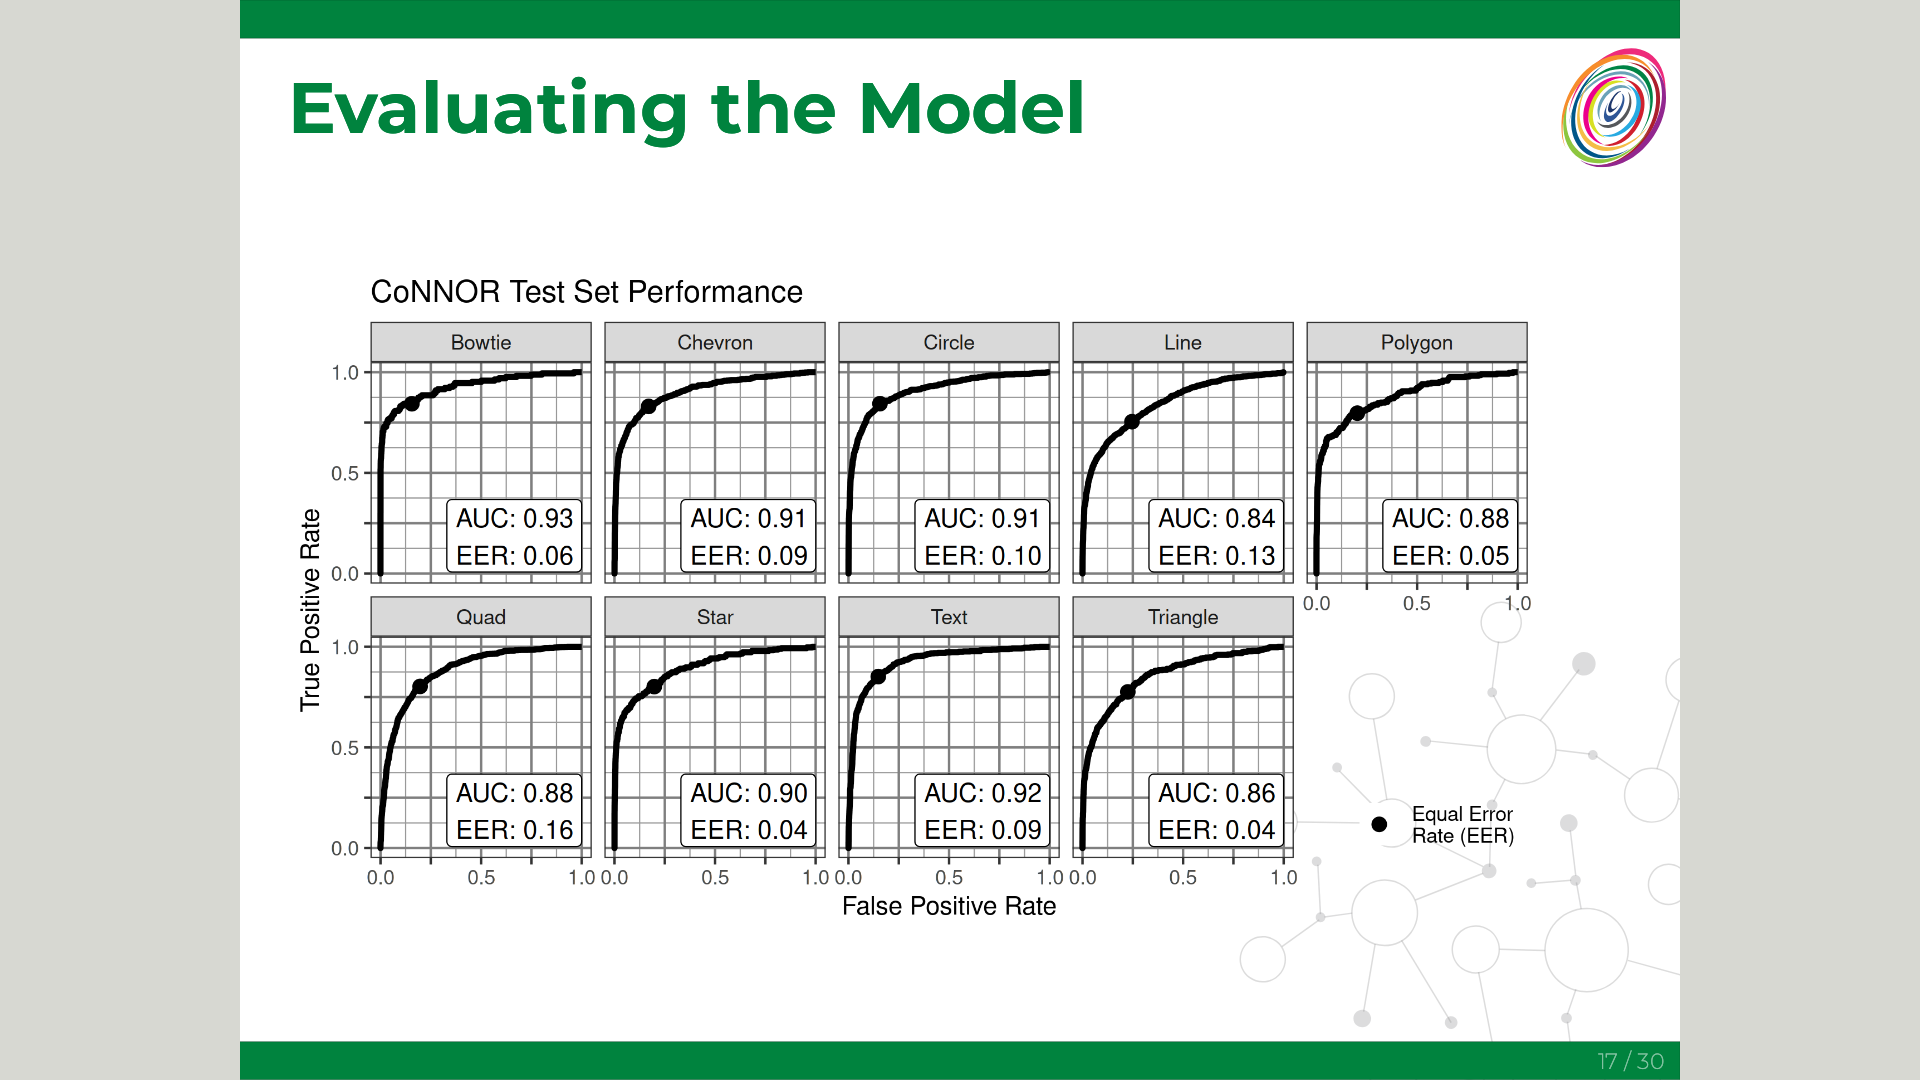
How Do You Define a Circle? Perception and Computer Vision Diagnostics
talks
Neural Networks are very complicated and very useful models for image recognition, but they are generally used to recognize very complex and multifaceted stimuli, like cars…
Dec 6, 2023
Susan Vanderplas, Muxin Hua
Measuring Your Tools, for Science!
other
This project is a bit of informal data collection meant to help me calibrate the likelihood of a random tool matching a wire in evidence of a given gauge/diameter.
Nov 18, 2023
Susan Vanderplas
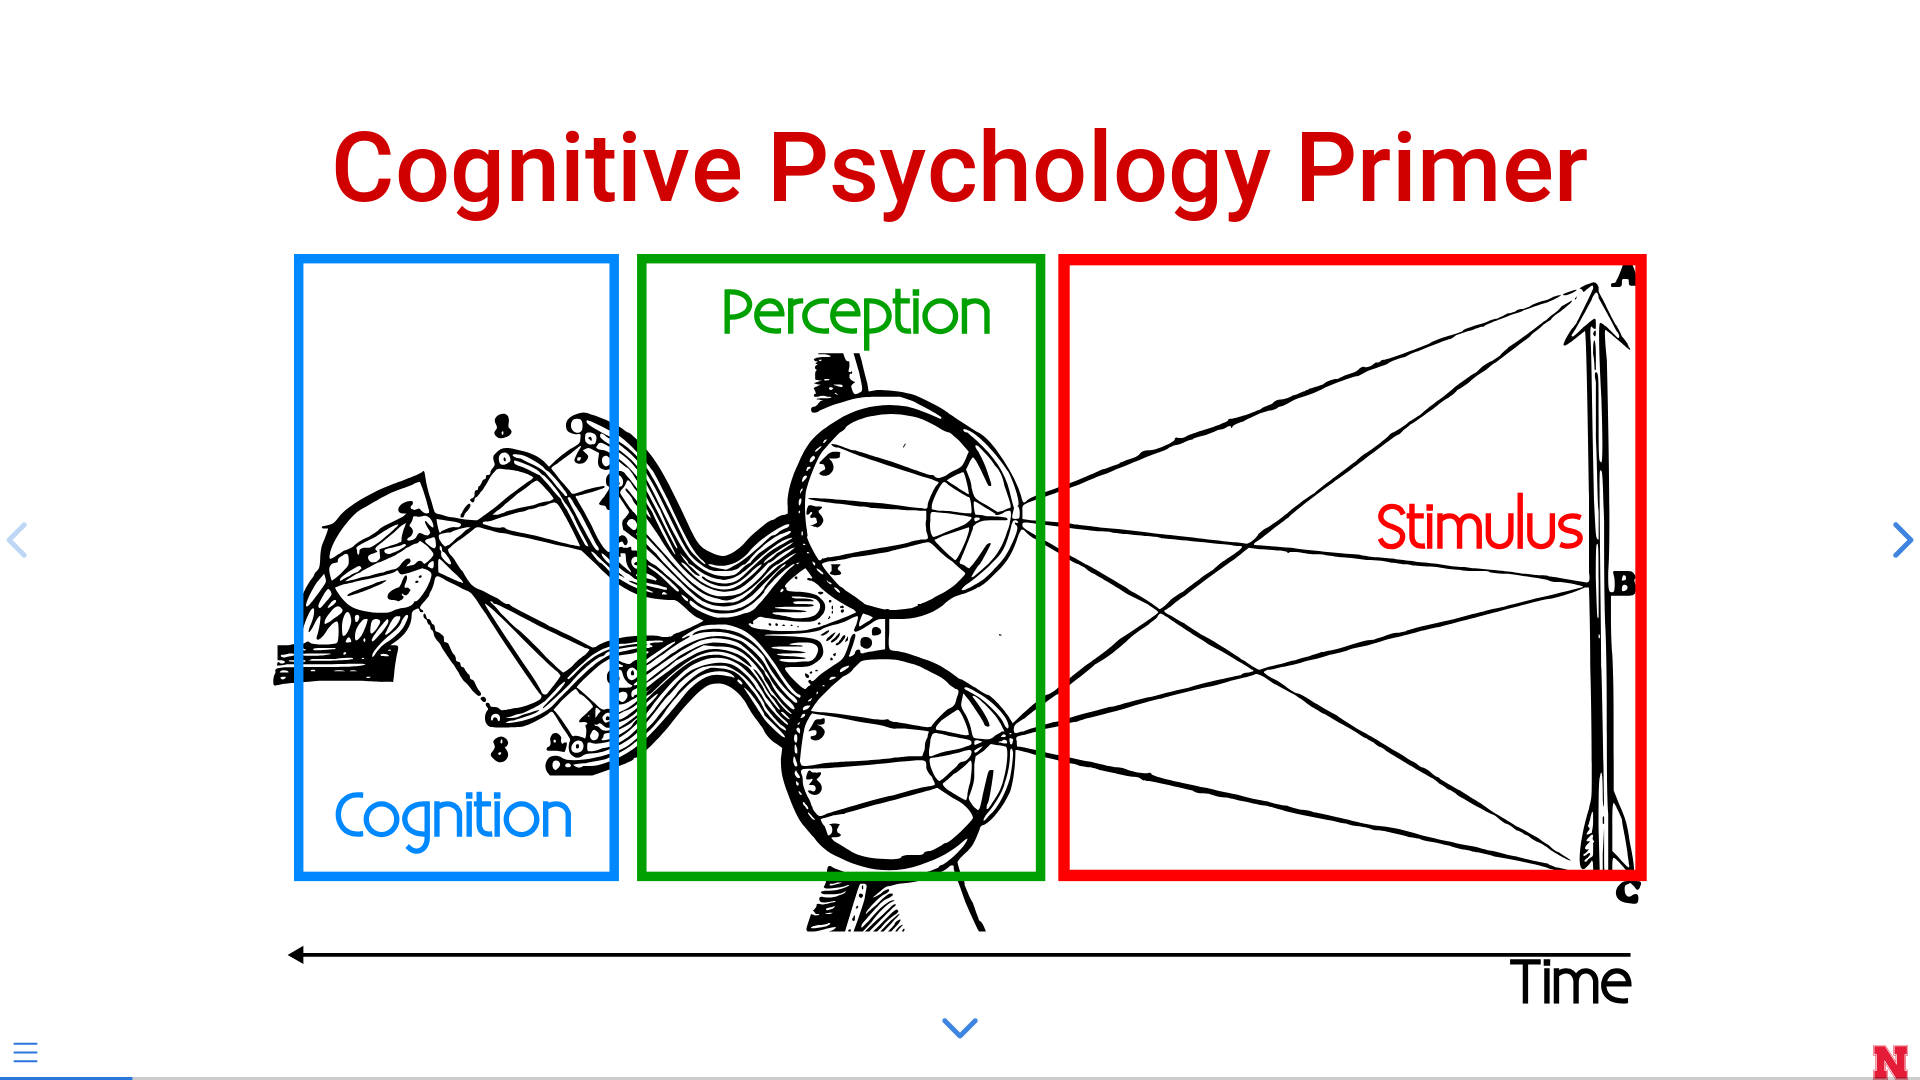
Graphics and Cognition: How Do We Perceive Charts?
talks
In this talk, I walk through a few cognitive components that affect how we use charts: perception, attention, and memory, with a focus on the process of understanding and…
Oct 12, 2023
Susan Vanderplas
Eye Fitting Straight Lines in the Modern Era
papers
How do statistical regression results compare to intuitive, visually fitted results? Fitting lines by eye through a set of points has been explored since the 20th century.…
Oct 2, 2023
Emily A. Robinson, Reka Howard, Susan VanderPlas
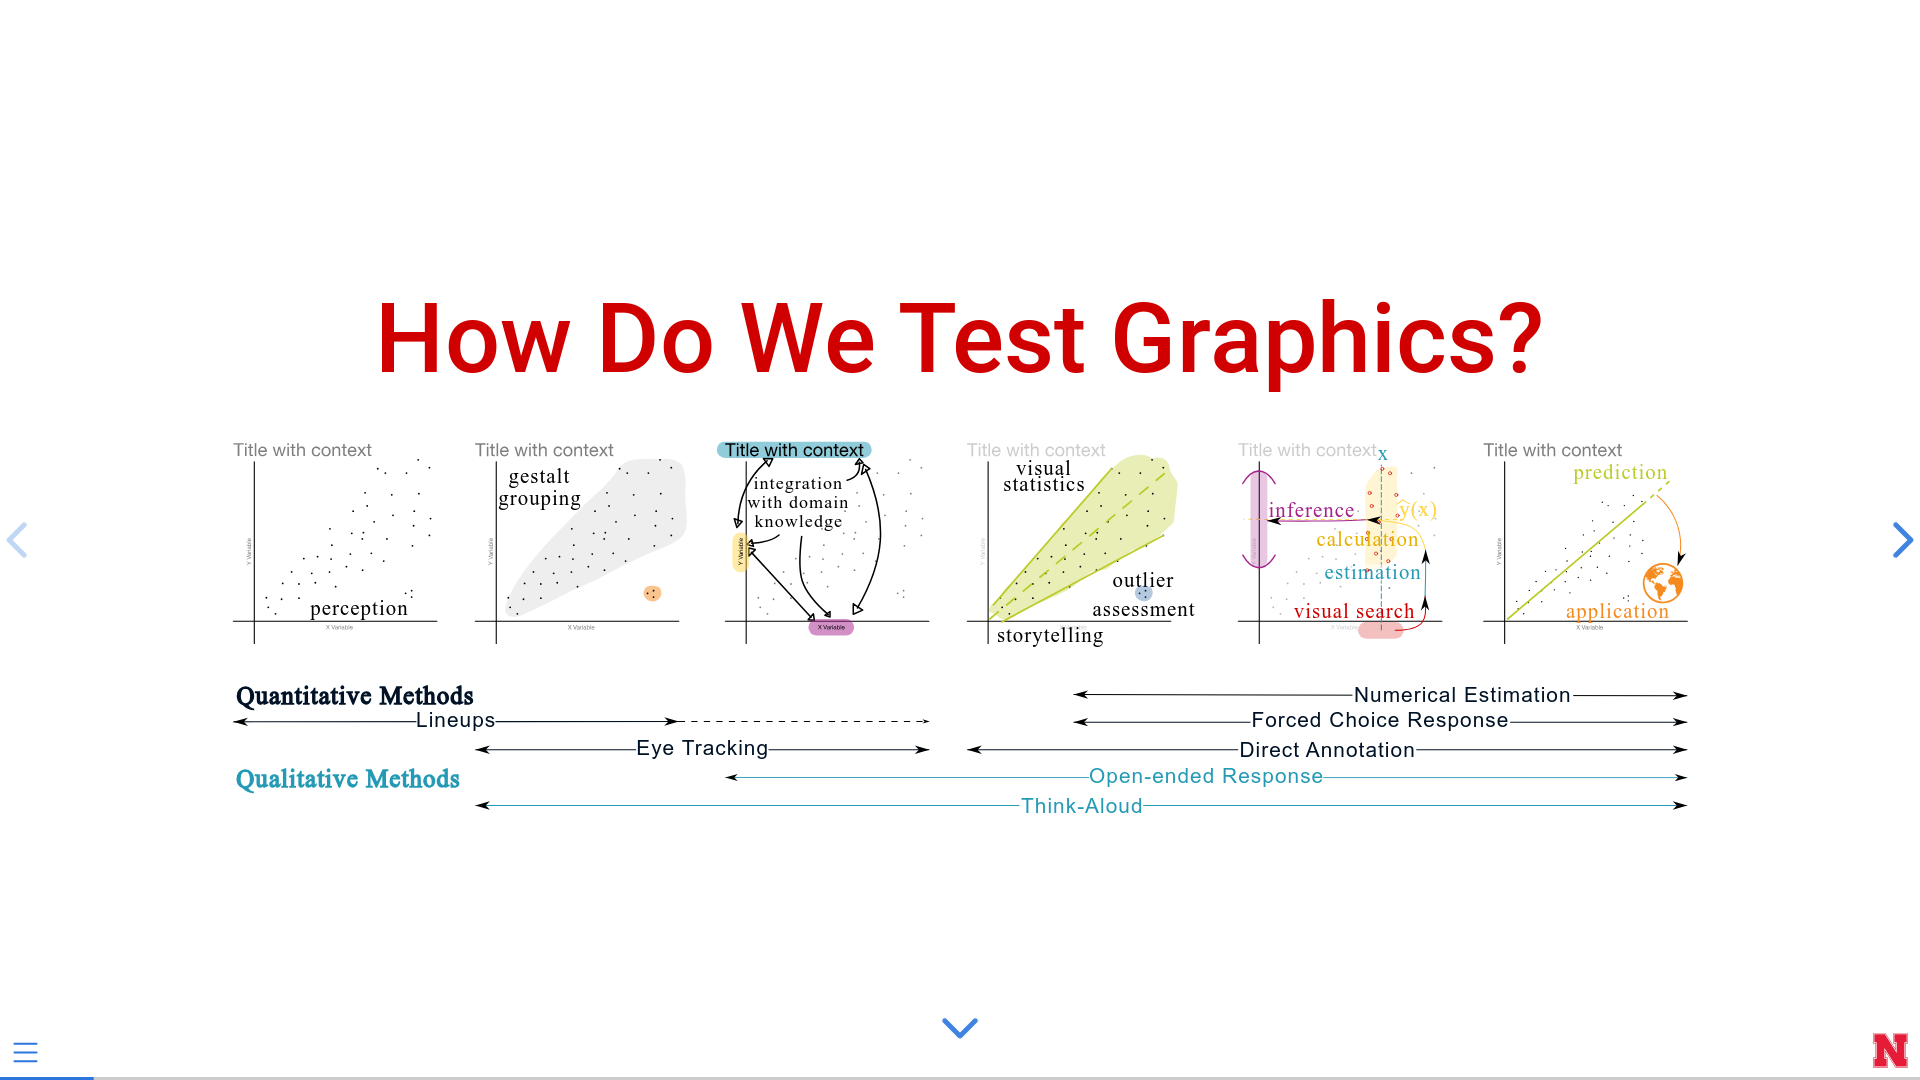
Testing Statistical Graphics
talks
NA
Aug 8, 2023
Susan Vanderplas
Penguins Go Parallel: a grammar of graphics framework for generalized parallel coordinate plots
papers
Parallel Coordinate Plots (PCP) are a valuable tool for exploratory data analysis of high-dimensional numerical data. The use of PCPs is limited when working with…
Apr 21, 2023
Susan VanderPlas, Yawei Ge, Antony Unwin, Heike Hofmann
What Makes a Good Graph? Graphical Testing and Principles for Graph Design
talks
NA
Mar 27, 2023
Susan Vanderplas
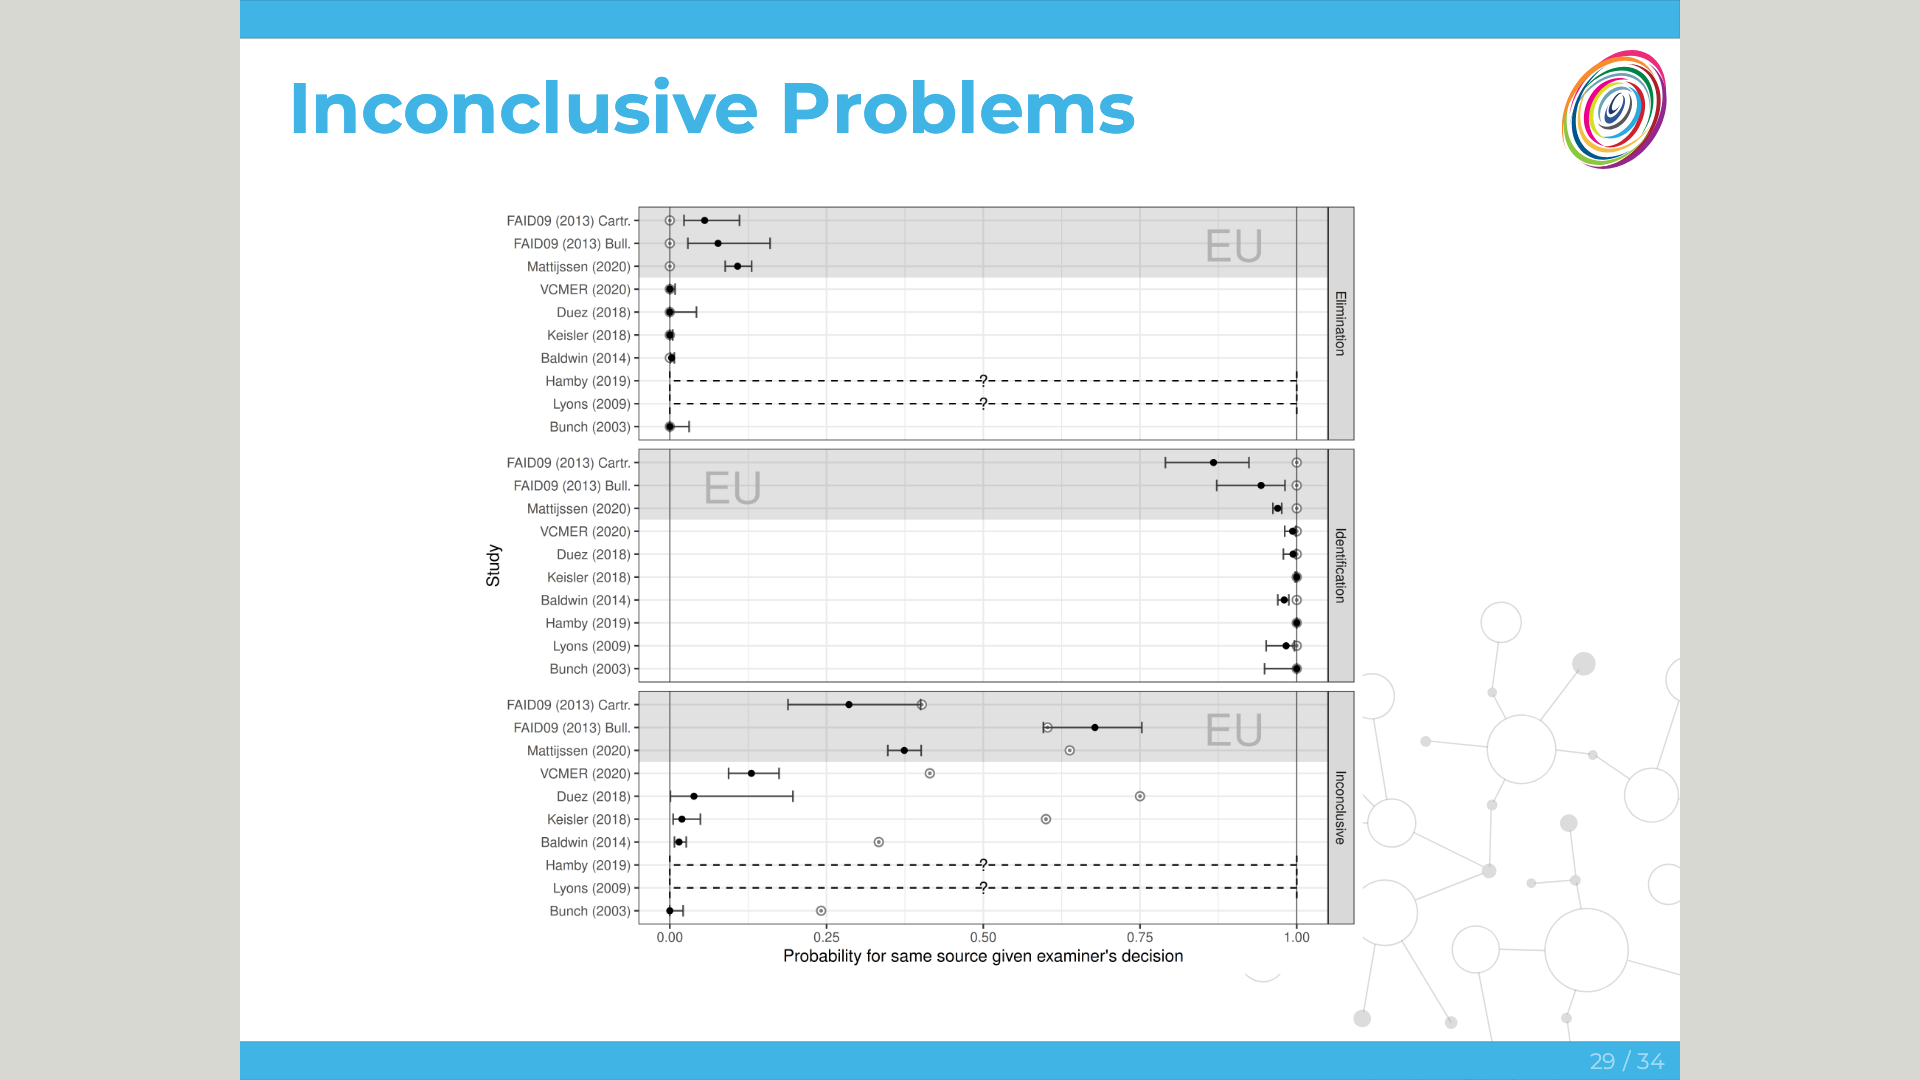
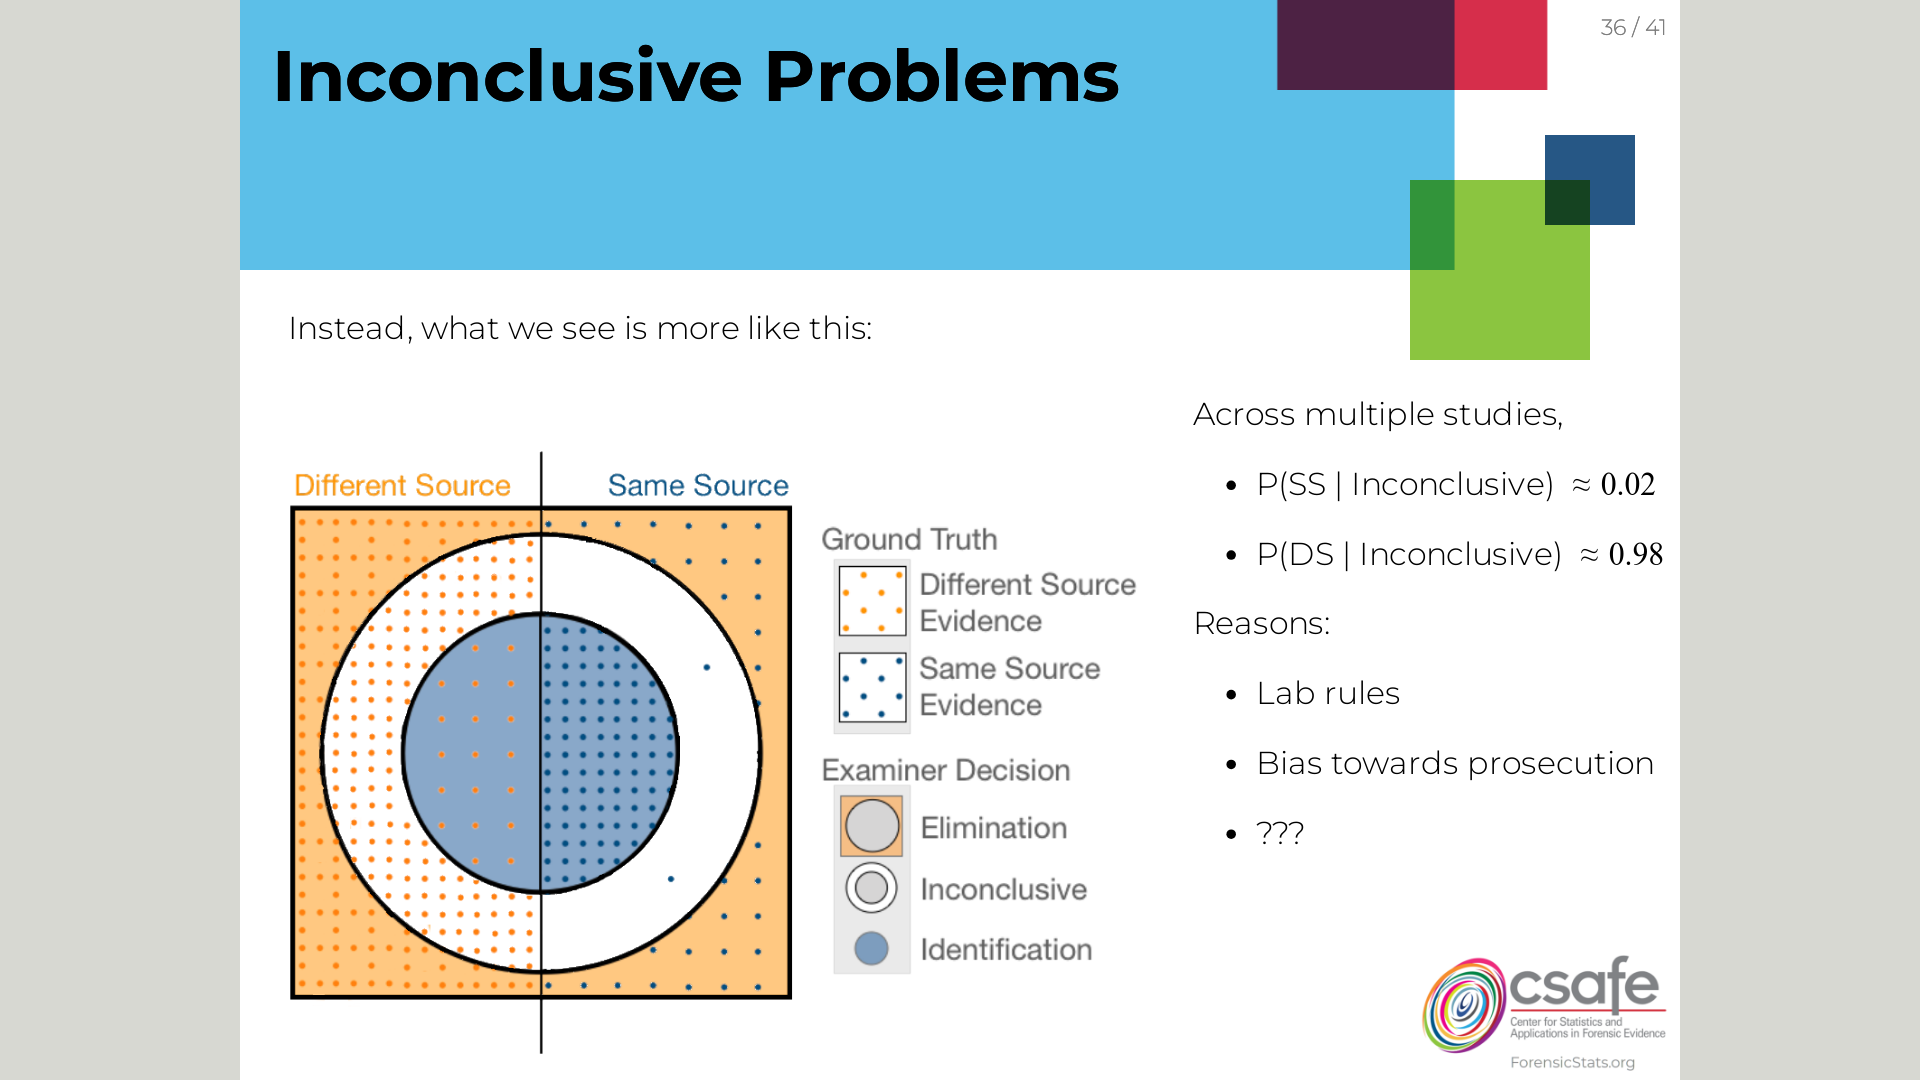
Inconclusive Conclusions: Biases and Consequences
talks
Forensic pattern evidence is often evaluated using categorical scales, such as identification (evidence is from the same source), inconclusive, or elimination (evidence is…
Feb 15, 2023
Susan Vanderplas
A Study in Reproducibility: The Congruent Matching Cells Algorithm and
cmcR
package
papers
[1] J. Zemmels, S. Vanderplas, and H. Hofmann. “A Study in Reproducibility: The Congruent Matching Cells Algorithm and cmcR package”. In:
R Journal
(4 Feb. 09, 2023)…
Feb 9, 2023
Joseph Zemmels, Susan Vanderplas, Heike Hofmann
You Draw It: Implementation of visually fitted trends with r2d3
papers
[1] E. Robinson, R. Howard, and S. VanderPlas. “You Draw It: Implementation of visually fitted trends with r2d3”. In:
Journal of Data Science
21 (2 Jan. 12, 2023)…
Jan 12, 2023
Emily Robinson, Reka Howard, Susan VanderPlas
Exploring Rural Shrink Smart Through Guided Discovery Dashboards
papers
[1] D. Bradford and S. VanderPlas. “Exploring Rural Shrink Smart Through Guided Discovery Dashboards”. In:
Journal of Data Science
(Dec. 2022), pp. 1-12. ISSN: 1680-743X.…
Dec 1, 2022
Denise Bradford, Susan VanderPlas
Visual Narratives of the Covid-19 pandemic
papers
[1] A. Wilhelm and S. VanderPlas. “Visual Narratives of the Covid-19 pandemic”. In:
Journal of Data Science, Statistics, and Visualisation
2.7 (Nov. 01, 2022), pp. 84-113.…
Nov 1, 2022
Adalbert Wilhelm, Susan VanderPlas
Reproducible Science: Statistics, Forensics, and the Law
talks
In science, we strive to design and create reproducible experiments that can be replicated by other researchers. We also usually require that scientists use good…
Oct 5, 2022
Susan Vanderplas
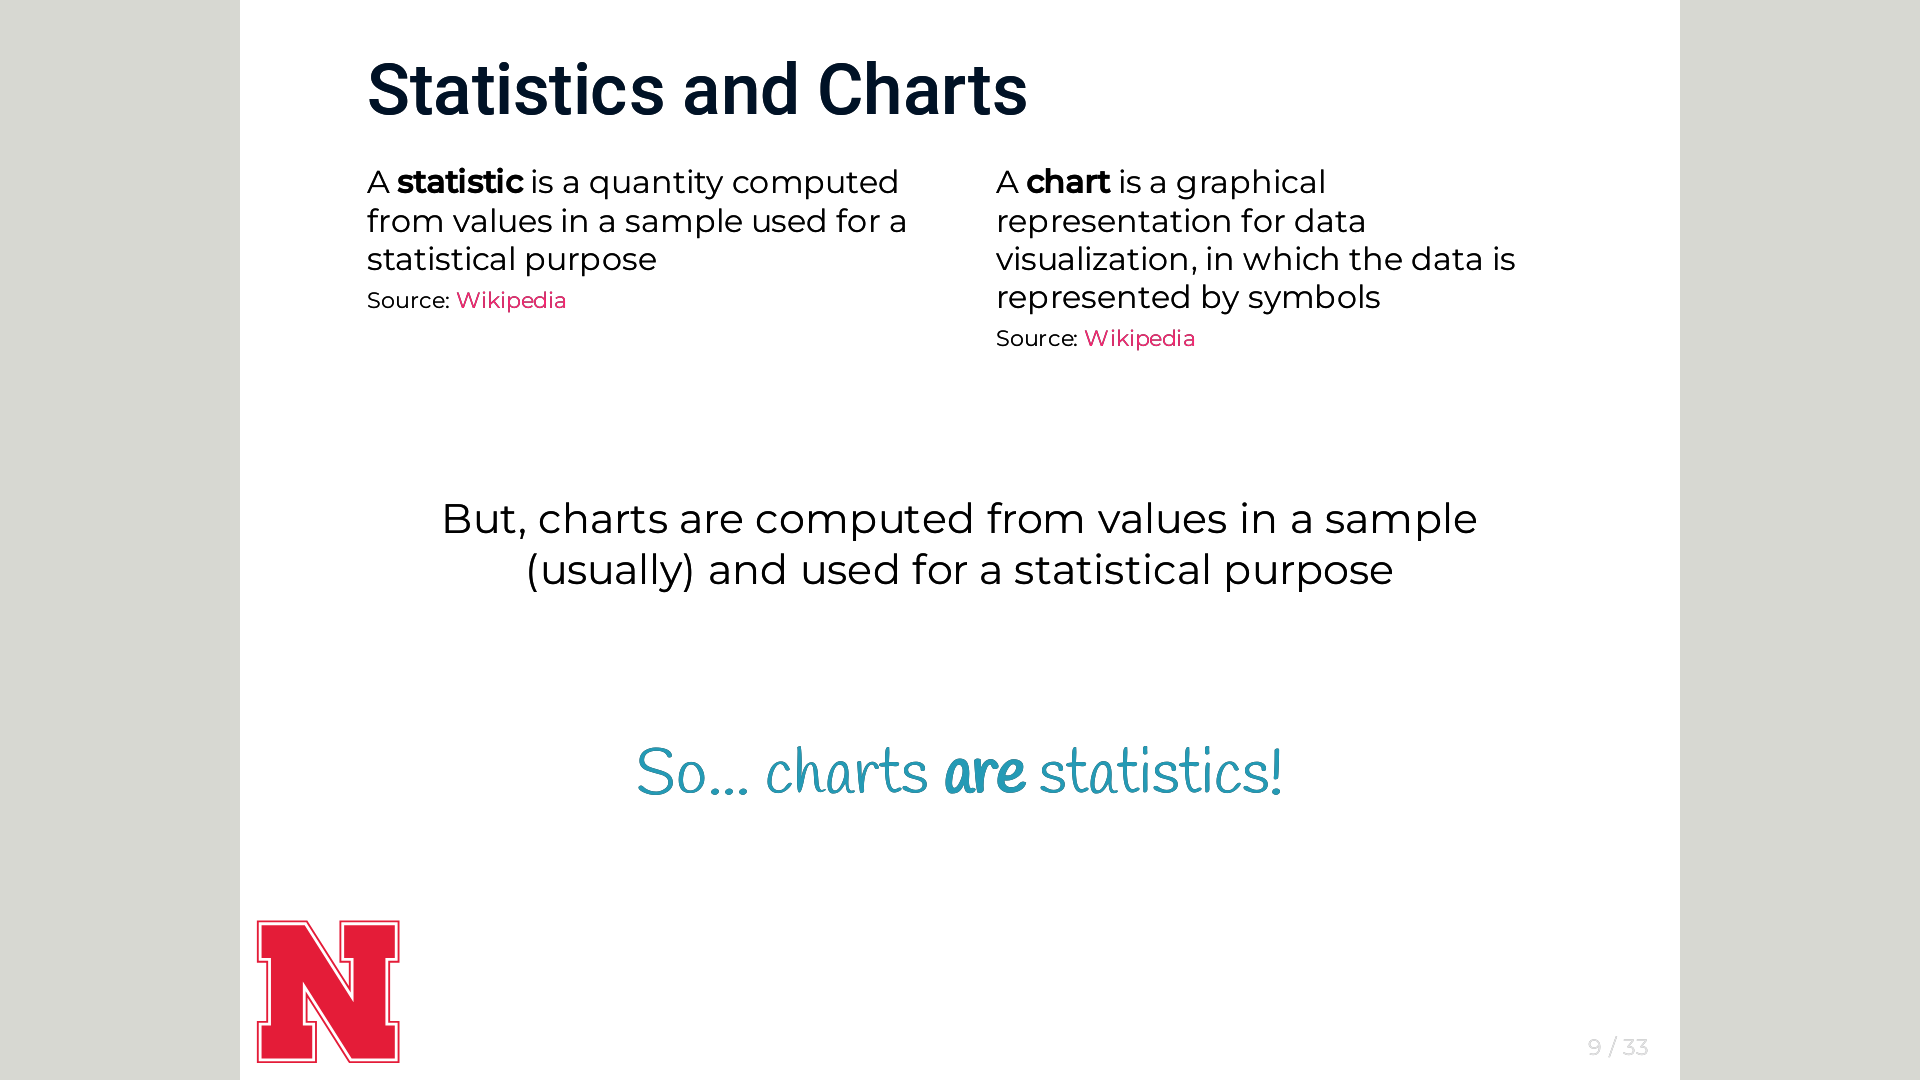
How to make good charts
talks
Data visualizations are an important component of scientific research and communication. We use charts to explore our data before we know how to model it, and we use charts…
Sep 22, 2022
Susan Vanderplas
Local Population Footwear Class Characteristics - An End-to-End Pipeline for Automatic Data Acquisition and Analysis
talks
In this workshop we demonstrate the use of a footwear scanner which can collect data about population-level tread characteristics in a local area. We discuss the scanner’s…
Aug 3, 2022
Susan Vanderplas, Rick Stone
From Scans to Scores
talks
3D microscopy has opened up ways to assess similarity between different sources of evidence. Algorithms are used to turn a pair of scans into a number. But what can these…
Aug 2, 2022
Susan Vanderplas, Heike Hofmann
An introduction to firearms examination for researchers in statistics
papers
In the United States, where firearms are readily accessible, the annual number of gun-related crimes is in the hundreds of thousands, and about two thirds of all murders are…
May 30, 2022
Susan Vanderplas, Alicia Carriquiry, Heike Hofmann, James Hamby, Xiao Hui Tai
Pandemics, Graphics, and Perception of Log Scales
talks
In 2020, there was suddenly worldwide interest in graphics on a level we don’t normally see - people were checking news sites daily looking for graphs, maps, and any…
Apr 8, 2022
Susan Vanderplas, Emily Robinson, Reka Howard
Automatic Acquisition of Footwear Class Characteristics
talks
NA
Mar 24, 2022
Susan Vanderplas, Rick Stone
Statistical significance calculations for scenarios in visual inference
papers
Statistical inference provides the protocols for conducting rigorous science, but data plots provide the opportunity to discover the unexpected. These disparate endeavours…
Dec 1, 2021
Susan Vanderplas, Christian Röttger, Dianne Cook, Heike Hofmann
Designing Graphics Requires Useful Experimental Testing Frameworks and Graphics Derived From Empirical Results
papers
Hullman and Gelman (2021, this issue) have provided a very thorough discussion of the premise that interactive exploratory data analysis requires a theoretical framework for…
Jul 30, 2021
Susan VanderPlas
Treatment of inconclusives in the AFTE range of conclusions
papers
In the past decade, and in response to the recommendations set forth by the National Research Council Committee on Identifying the Needs of the Forensic Sciences Community…
May 5, 2021
Heike Hofmann, Alicia Carriquiry, Susan Vanderplas
Exploring Rural Quality of Life Using Data Science and Public Data
talks
In many situations, subjective assessments and objective data capture similar (but not identical) aspects of the same underlying phenomenon. In this talk, I’ll discuss how…
Apr 9, 2021
Susan Vanderplas, Denise Bradford
Visual Statistics: Communication and Graphical Testing
talks
NA
Mar 16, 2021
Susan Vanderplas
Welcome to Forensic Statistics
talks
NA
Feb 5, 2021
Susan Vanderplas
Perception and Visual Communication in a Global Pandemic
talks
In the early months of 2020, as the novel coronavirus spread around the globe, we all turned to graphics and data visualizations in order to make sense of the unfolding…
Jul 29, 2020
Susan Vanderplas
Statistical Evaluation of Firearms and Toolmark Evidence
talks
NA
Mar 11, 2020
Susan Vanderplas
Testing Statistical Charts: What Makes a Good Graph?
papers
It has been approximately 100 years since the very first formal experimental evaluations of statistical charts were conducted. In that time, technological changes have…
Mar 1, 2020
Susan Vanderplas, Dianne Cook, Heike Hofmann
Comparison of three similarity scores for bullet LEA matching
papers
Recent advances in microscopy have made it possible to collect 3D topographic data, enabling more precise virtual comparisons based on the collected 3D data as a supplement…
Mar 1, 2020
Susan Vanderplas, Melissa Nally, Tylor Klep, Cristina Cadevall, Heike Hofmann
One of these things is not like the others: Visual Statistics and Testing in Statistical Graphics
talks
NA
Feb 11, 2020
Susan Vanderplas, Heike Hofmann
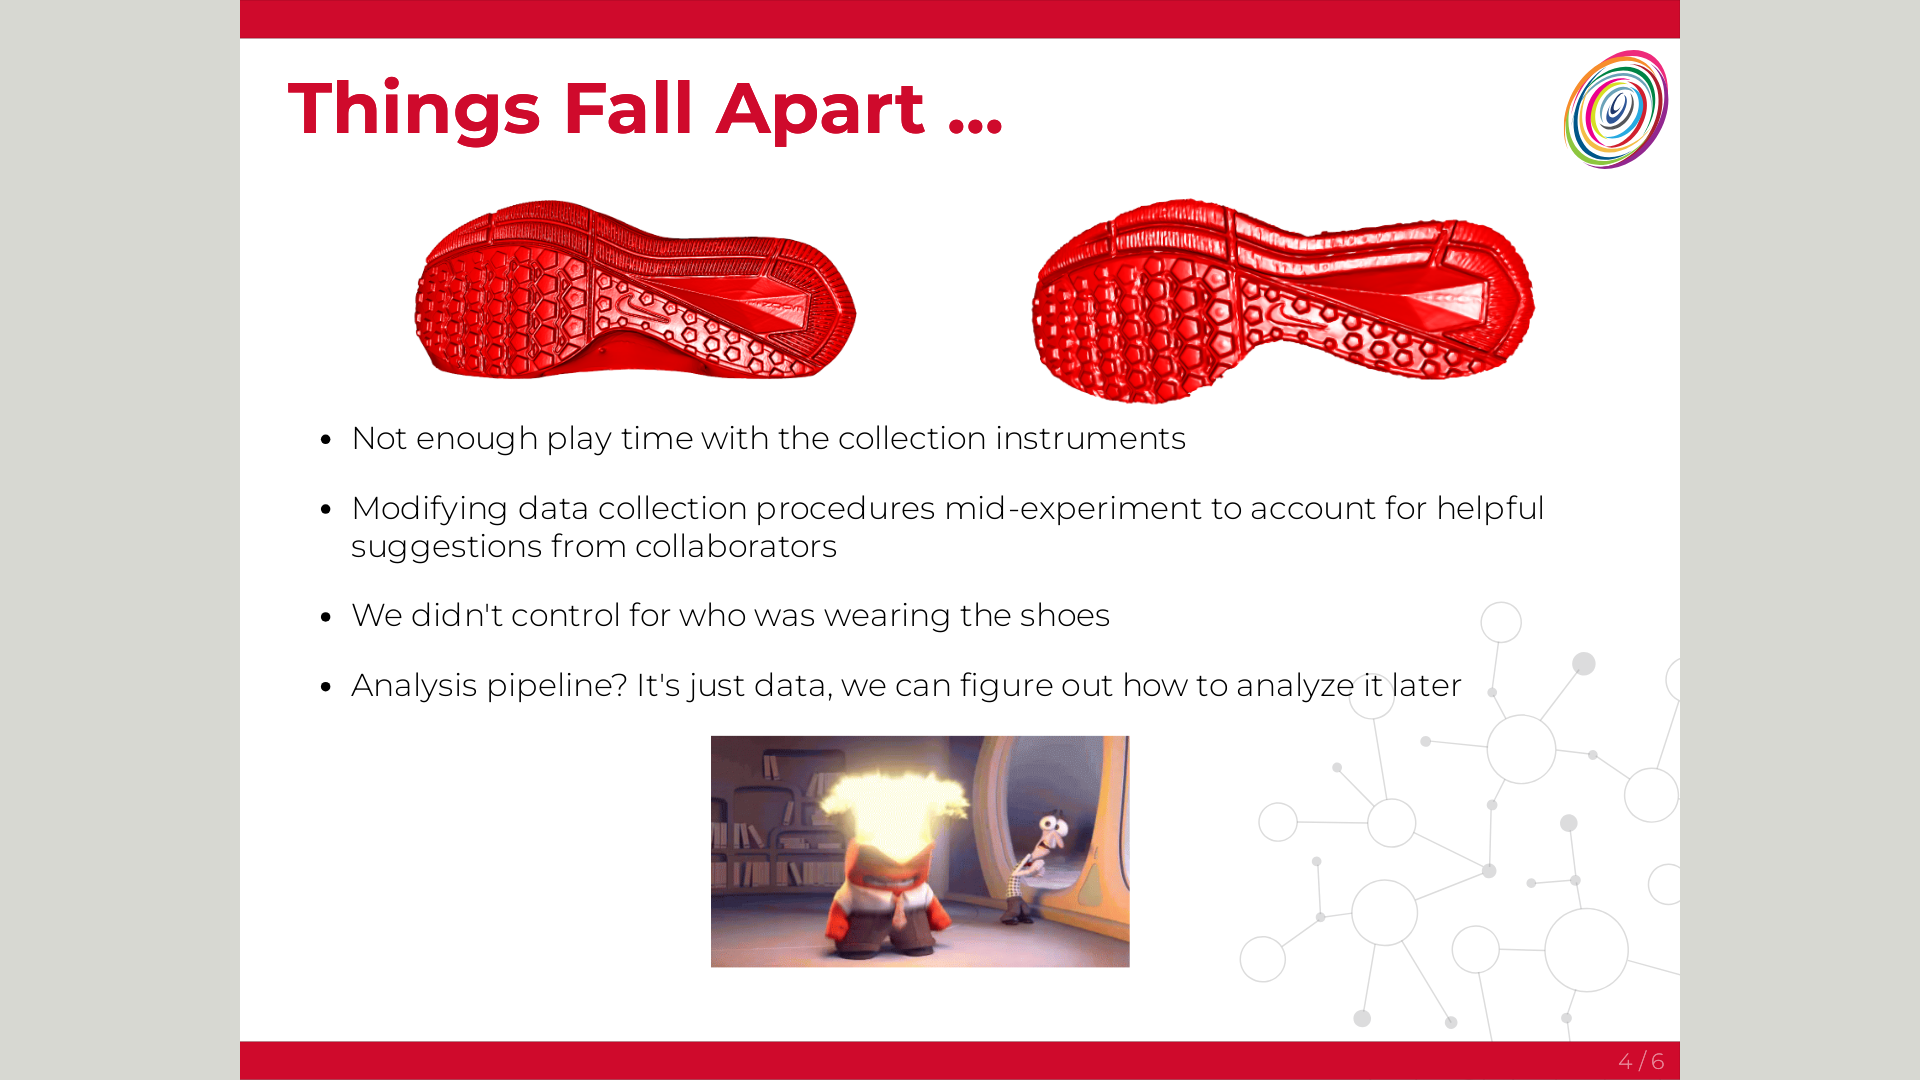
Big Data, Big Experiments, and Big Problems
talks
If data creates problems, then big data creates even bigger problems. In this talk, I discuss many different ways you can ensure a study fails, and how those decisions are…
Jan 12, 2020
Susan Vanderplas
Statistical Lineups for Bayesians
talks
Graphics play a crucial role in statistical analysis and data mining. The lineup protocol for experimentally testing graphics has traditionally used p-values to identify…
Jul 31, 2019
Susan Vanderplas, Heike Hofmann
ggenealogy
: An R Package for Visualizing Genealogical Data
papers
This paper introduces ggenealogy (Rutter, Vanderplas, and Cook 2019), a developing R software package that provides tools for searching through genealogical data, generating…
May 29, 2019
Lindsay Rutter, Susan Vanderplas, Dianne Cook, Michelle Graham
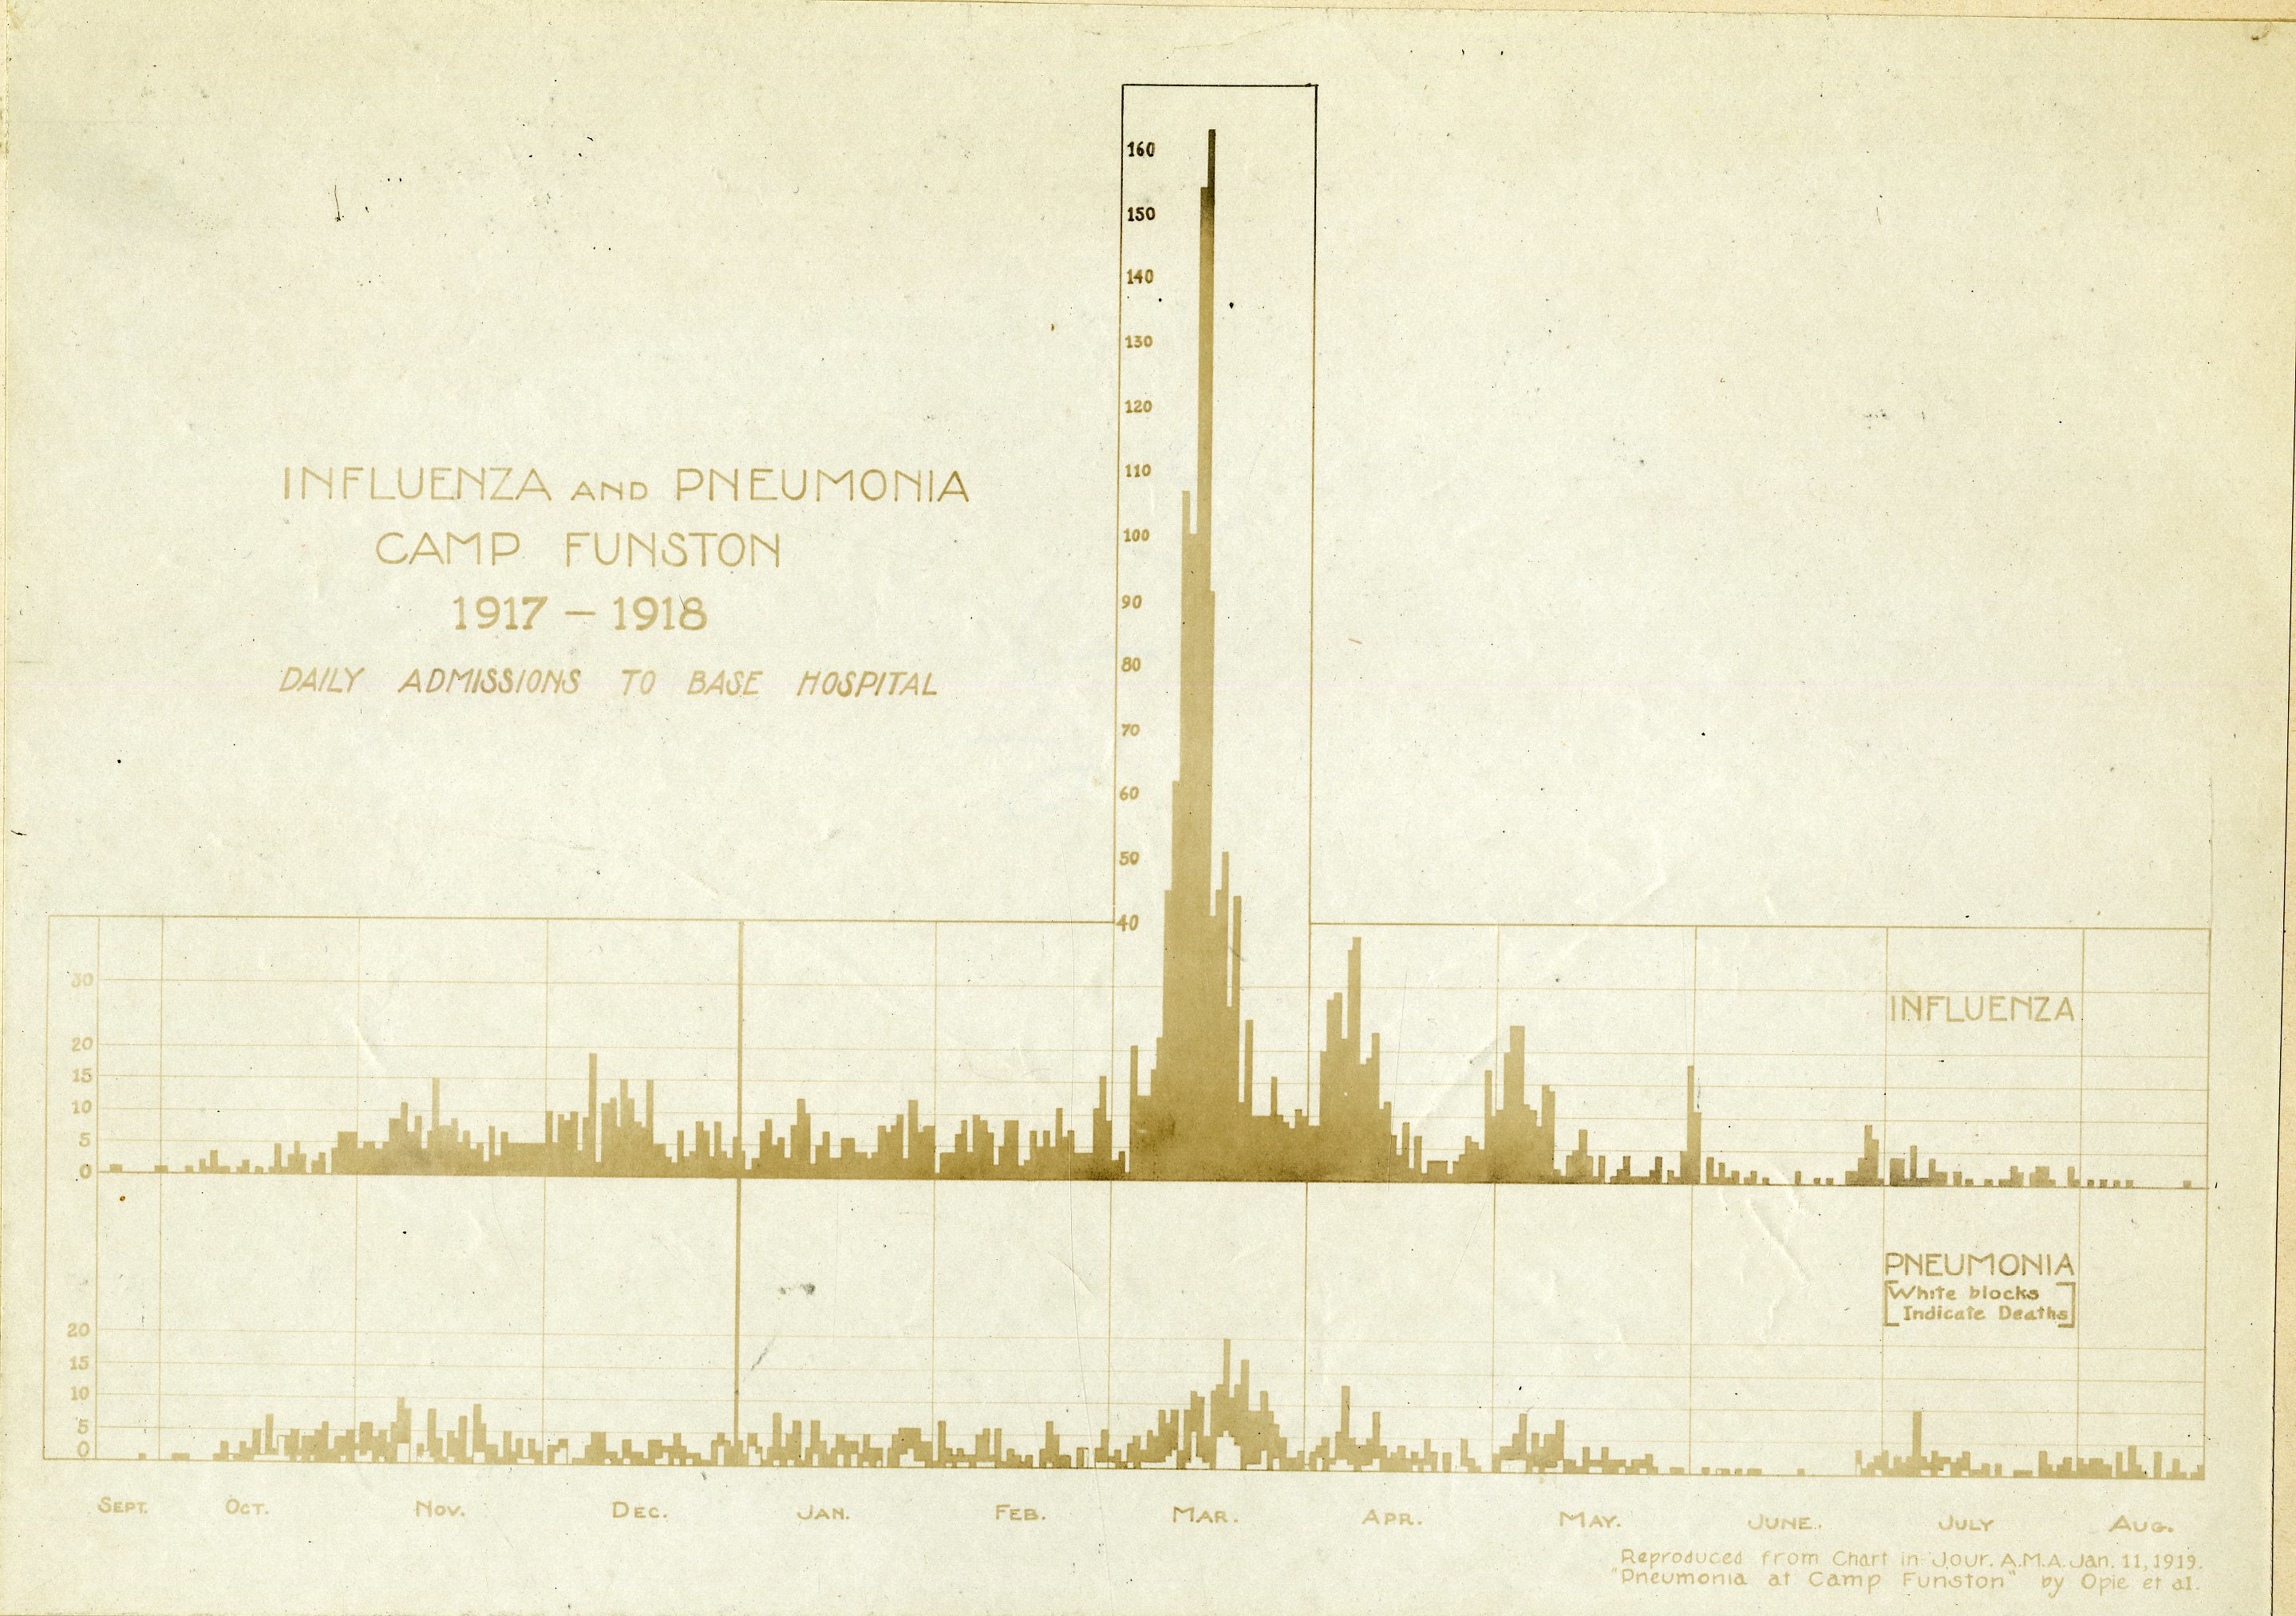
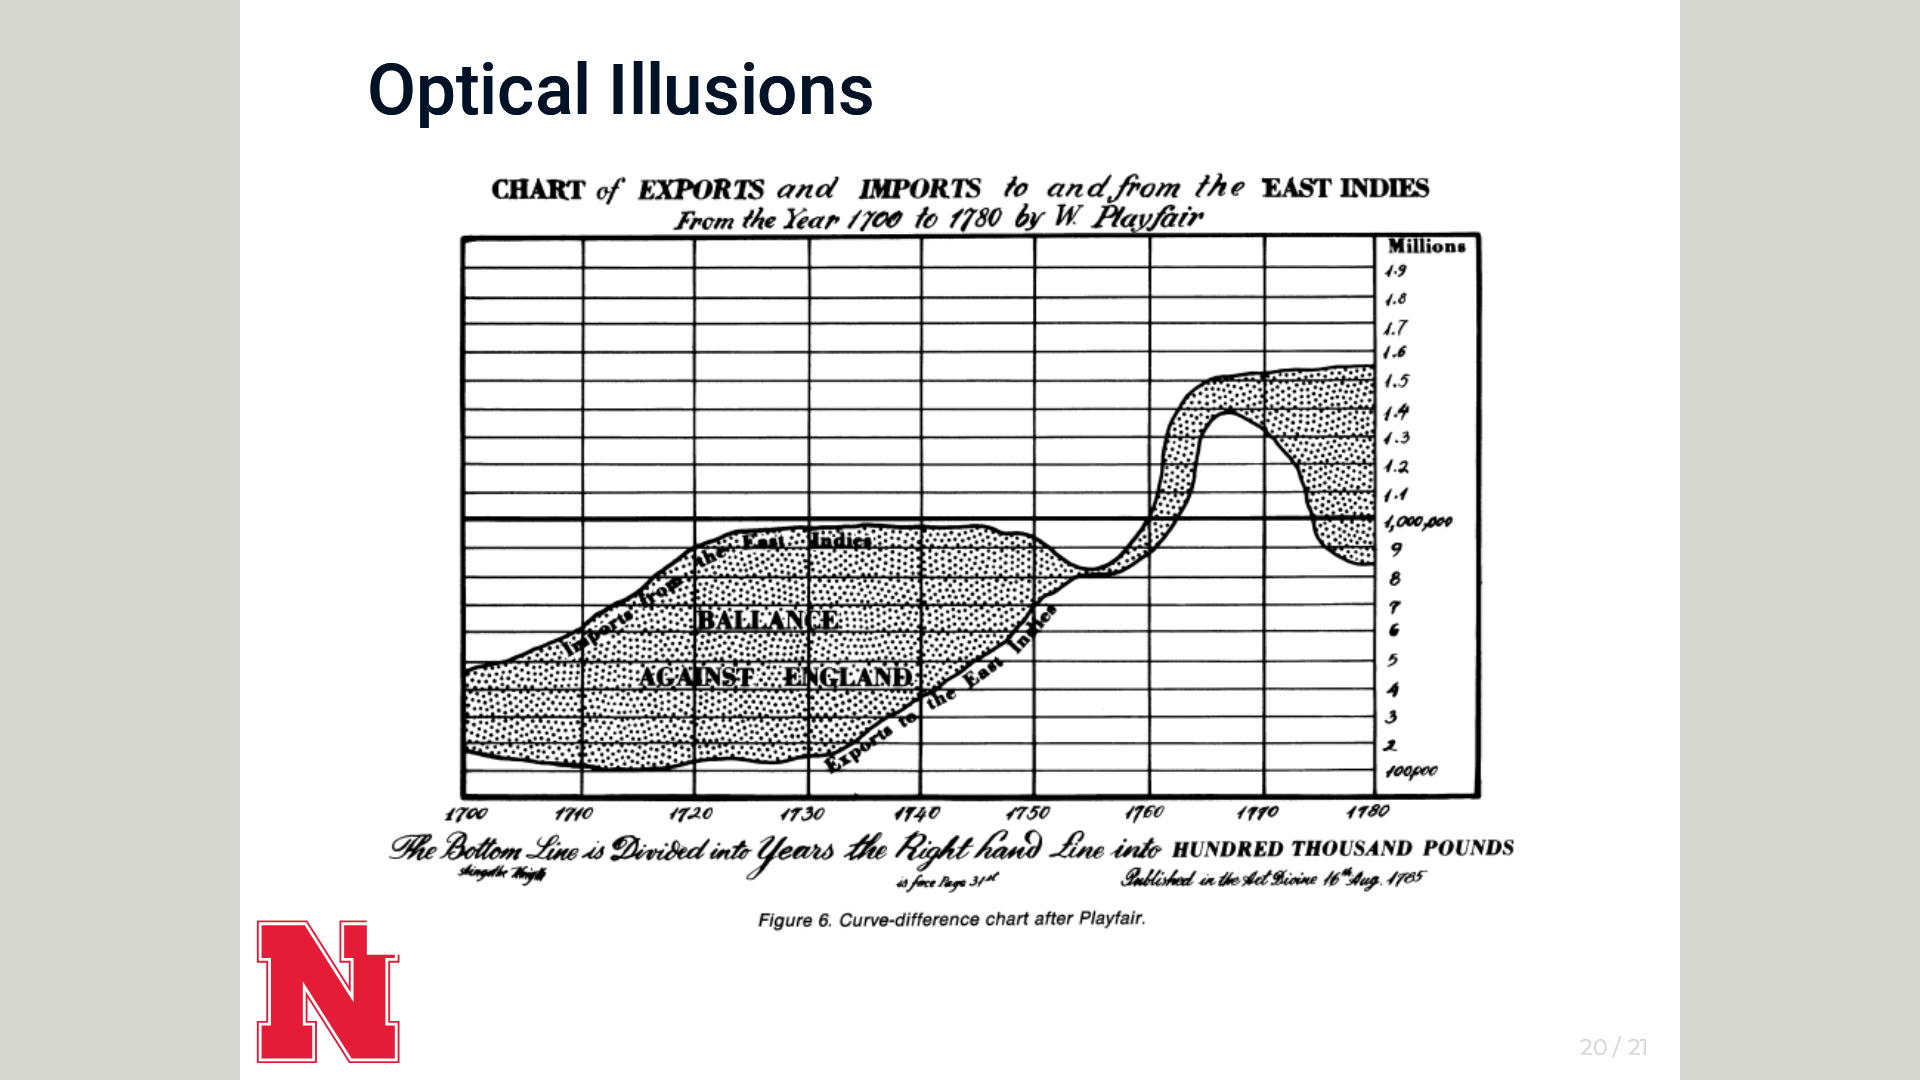
Framed! Reproducing and Revisiting 150-Year-Old Charts
papers
AbstractThe Statistical Atlases published by the Census Bureau in the late 1800s utilized a number of novel methods for displaying data. In this paper, we examine the use of…
Apr 1, 2019
Susan Vanderplas, Ryan C Goluch, Heike Hofmann
Extending
ggplot2
for Linked and Animated Web Graphics
papers
Interactive web graphics are great for communication and knowledge sharing, but are difficult to leverage during the exploratory phase of a data science workflow. Even…
Apr 1, 2019
Carson Sievert, Susan Vanderplas, Jun Cai, Kevin Ferris, Faizan Uddin Fahad Khan, Toby Dylan Hocking
Machine learning in forensic applications
papers
The 2009 National Academy of Sciences report found pattern-evidence disciplines to be rife with subjectivity. In the decade since, machine learning methods have been…
Apr 1, 2019
Alicia Carriquiry, Heike Hofmann, Xiao Hui Tai, Susan Vanderplas
Framed Charts in the 1870 Statistical Atlas
talks
Computational Reproducibility is a fundamental aspect of the scientific method. One question that we need to therefore ask ourselves is “how reproducible are our charts?”.…
Aug 1, 2018
Susan Vanderplas, Heike Hofmann
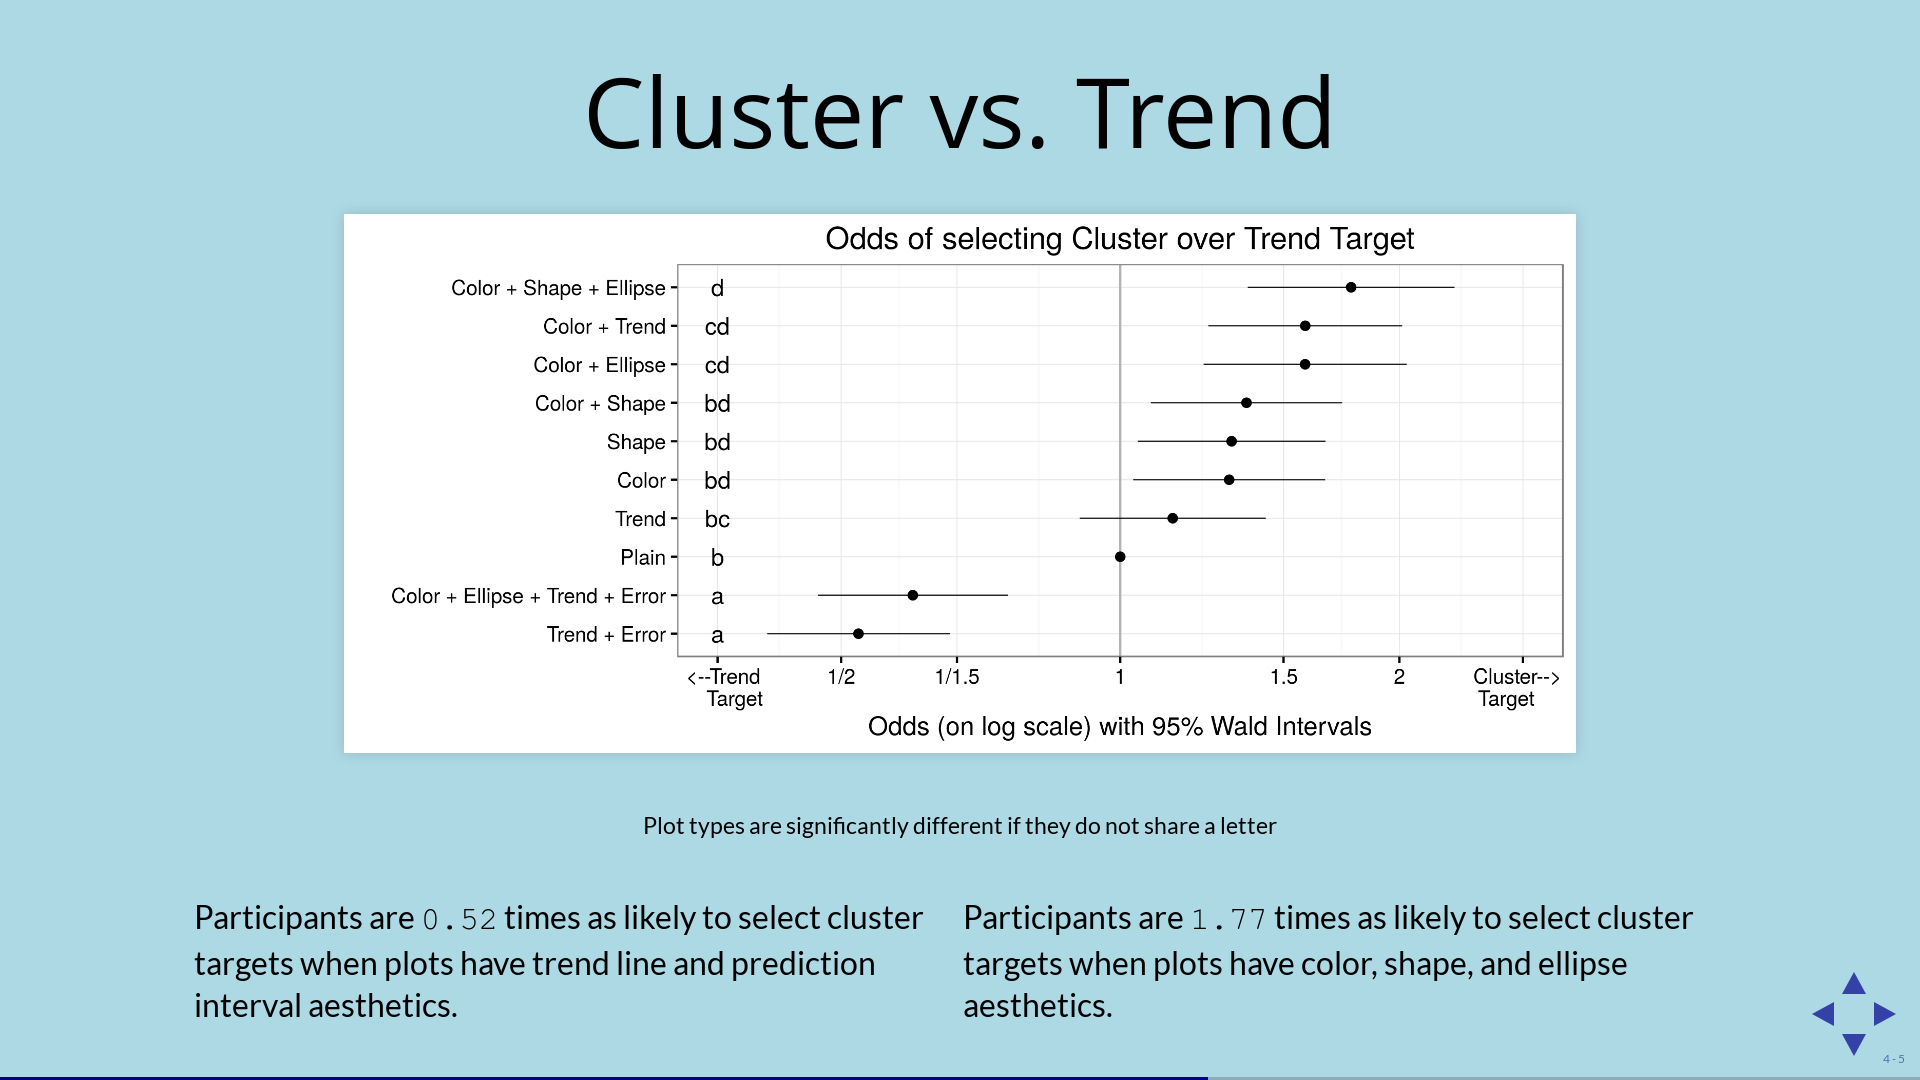
Clusters Beat Trend!? Testing Feature Hierarchy in Statistical Graphics
talks
Graphics are very effective for communicating numerical information quickly and efficiently, but many of the design choices we make are based on subjective measures, such as…
May 17, 2018
Susan Vanderplas, Heike Hofmann
All of This Has Happened Before. All of This Will Happen Again: Data Science
papers
David Donoho’s “50 Years of Data Science” provides a valuable perspective on the statistics-vs-data science debate that has been raging in academic statistics departments…
Dec 19, 2017
Heike Hofmann, Susan Vanderplas
A Bayesian Approach to Visual Inference
talks
Graphics play a crucial role in statistical analysis and data mining. The lineup protocol for experimentally testing graphics has traditionally used p-values to identify…
Aug 2, 2017
Susan Vanderplas, Heike Hofmann
Clusters Beat Trend!? Testing Feature Hierarchy in Statistical Graphics
papers
Graphics are very effective for communicating numerical information quickly and efficiently, but many of the design choices we make are based on subjective measures, such as…
Apr 24, 2017
Susan Vanderplas, Heike Hofmann
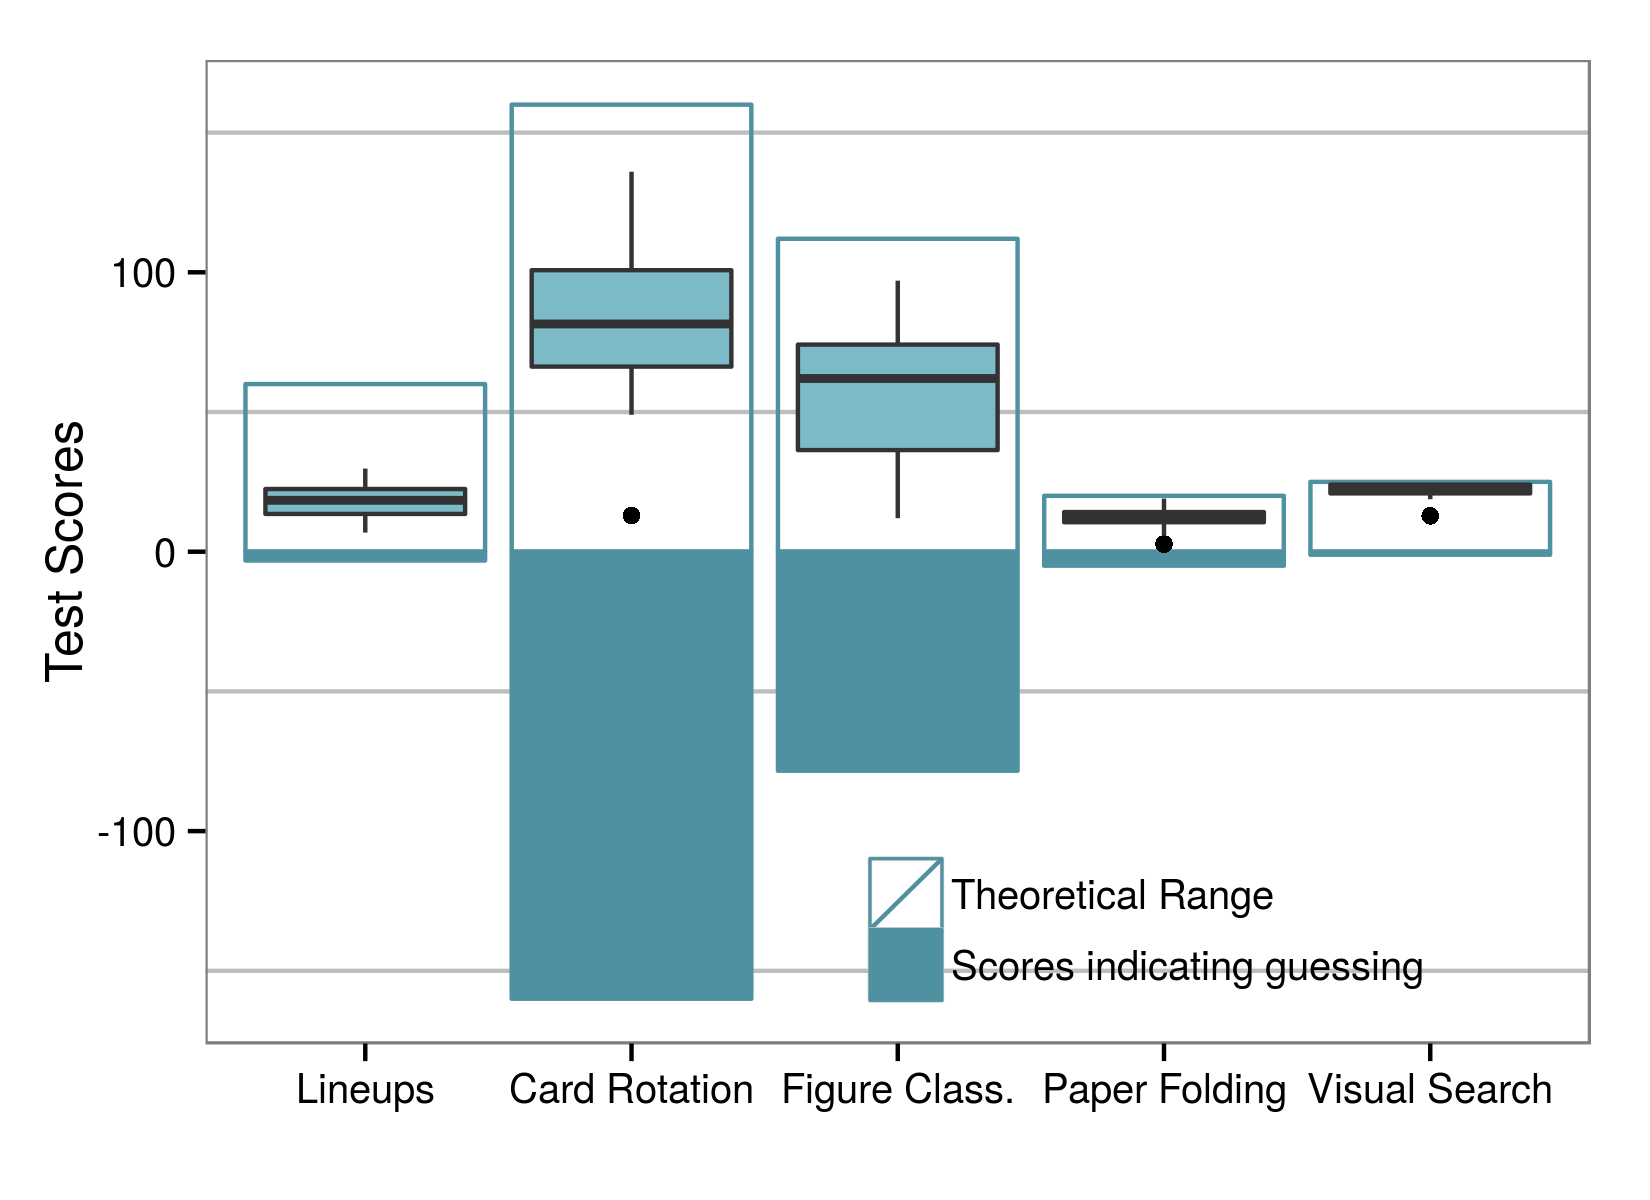
Spatial Reasoning and Data Displays
papers
Graphics convey numerical information very efficiently, but rely on a different set of mental processes than tabular displays. Here, we present a study relating demographic…
Dec 31, 2016
Susan VanderPlas, Heike Hofmann
Signs of the Sine Illusion - why we need to care
papers
Graphical representations have to be true to the data they display. Computational tools ensure this on a technical level. But we also need to take “flaws” of the human…
Dec 10, 2015
Susan Vanderplas, Heike Hofmann
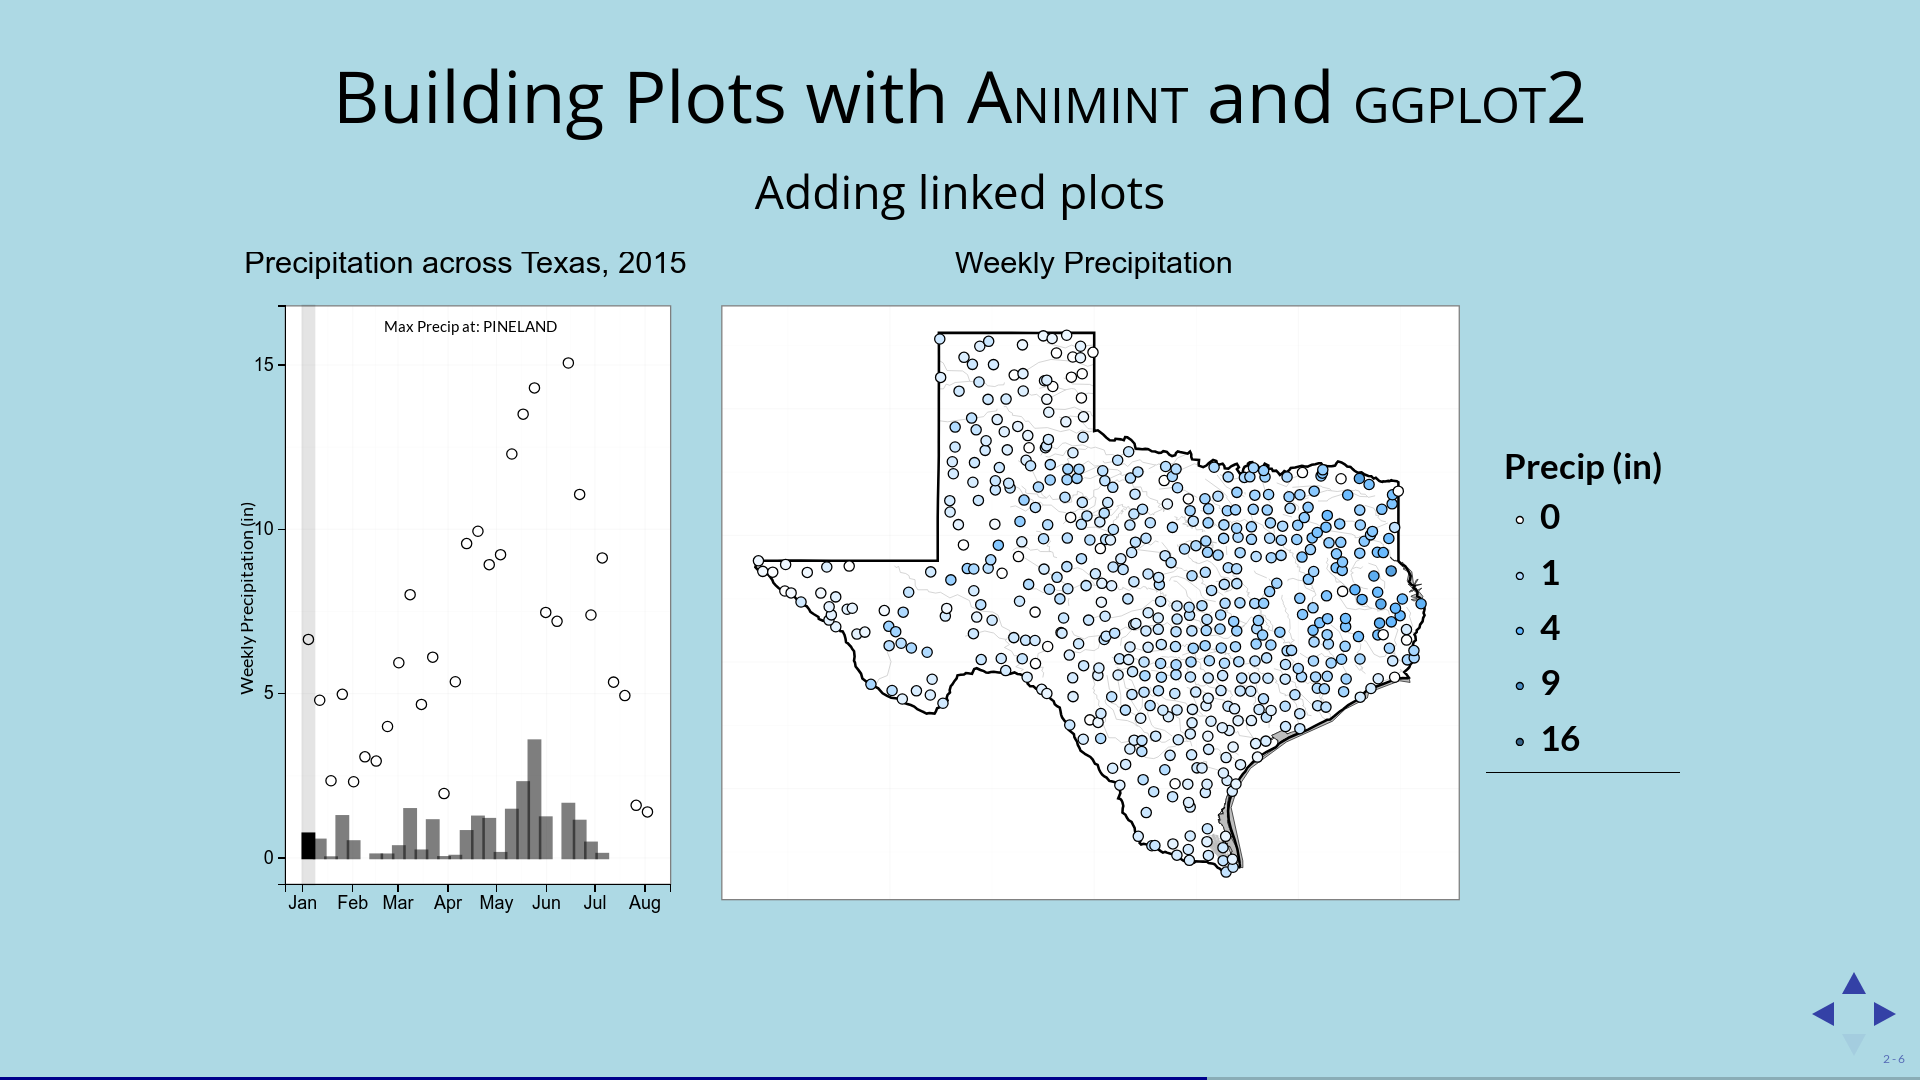
Animint: Interactive Web-Based Animations using Ggplot2’s Grammar of Graphics
talks
Animint is a high-level modification of the grammar of graphics used in ggplot2 for linked, interactive, animated plots. It builds on top of ggplot2 to create interactive…
Aug 10, 2015
Susan Vanderplas, Toby Hocking
Visual Aptitude and Statistical Graphics
talks
NA
Aug 10, 2015
Susan Vanderplas, Heike Hofmann
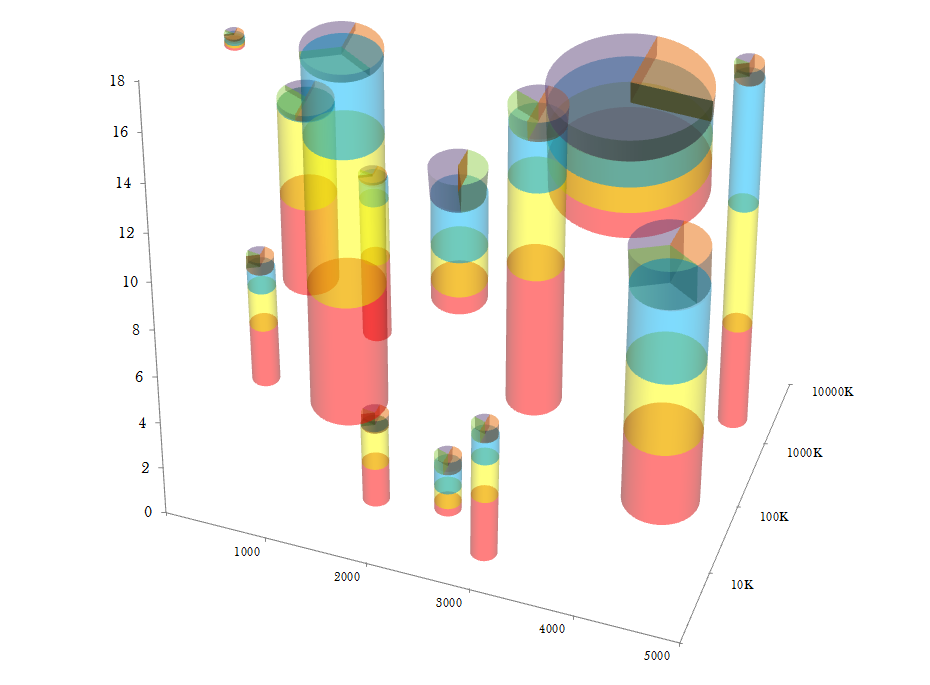
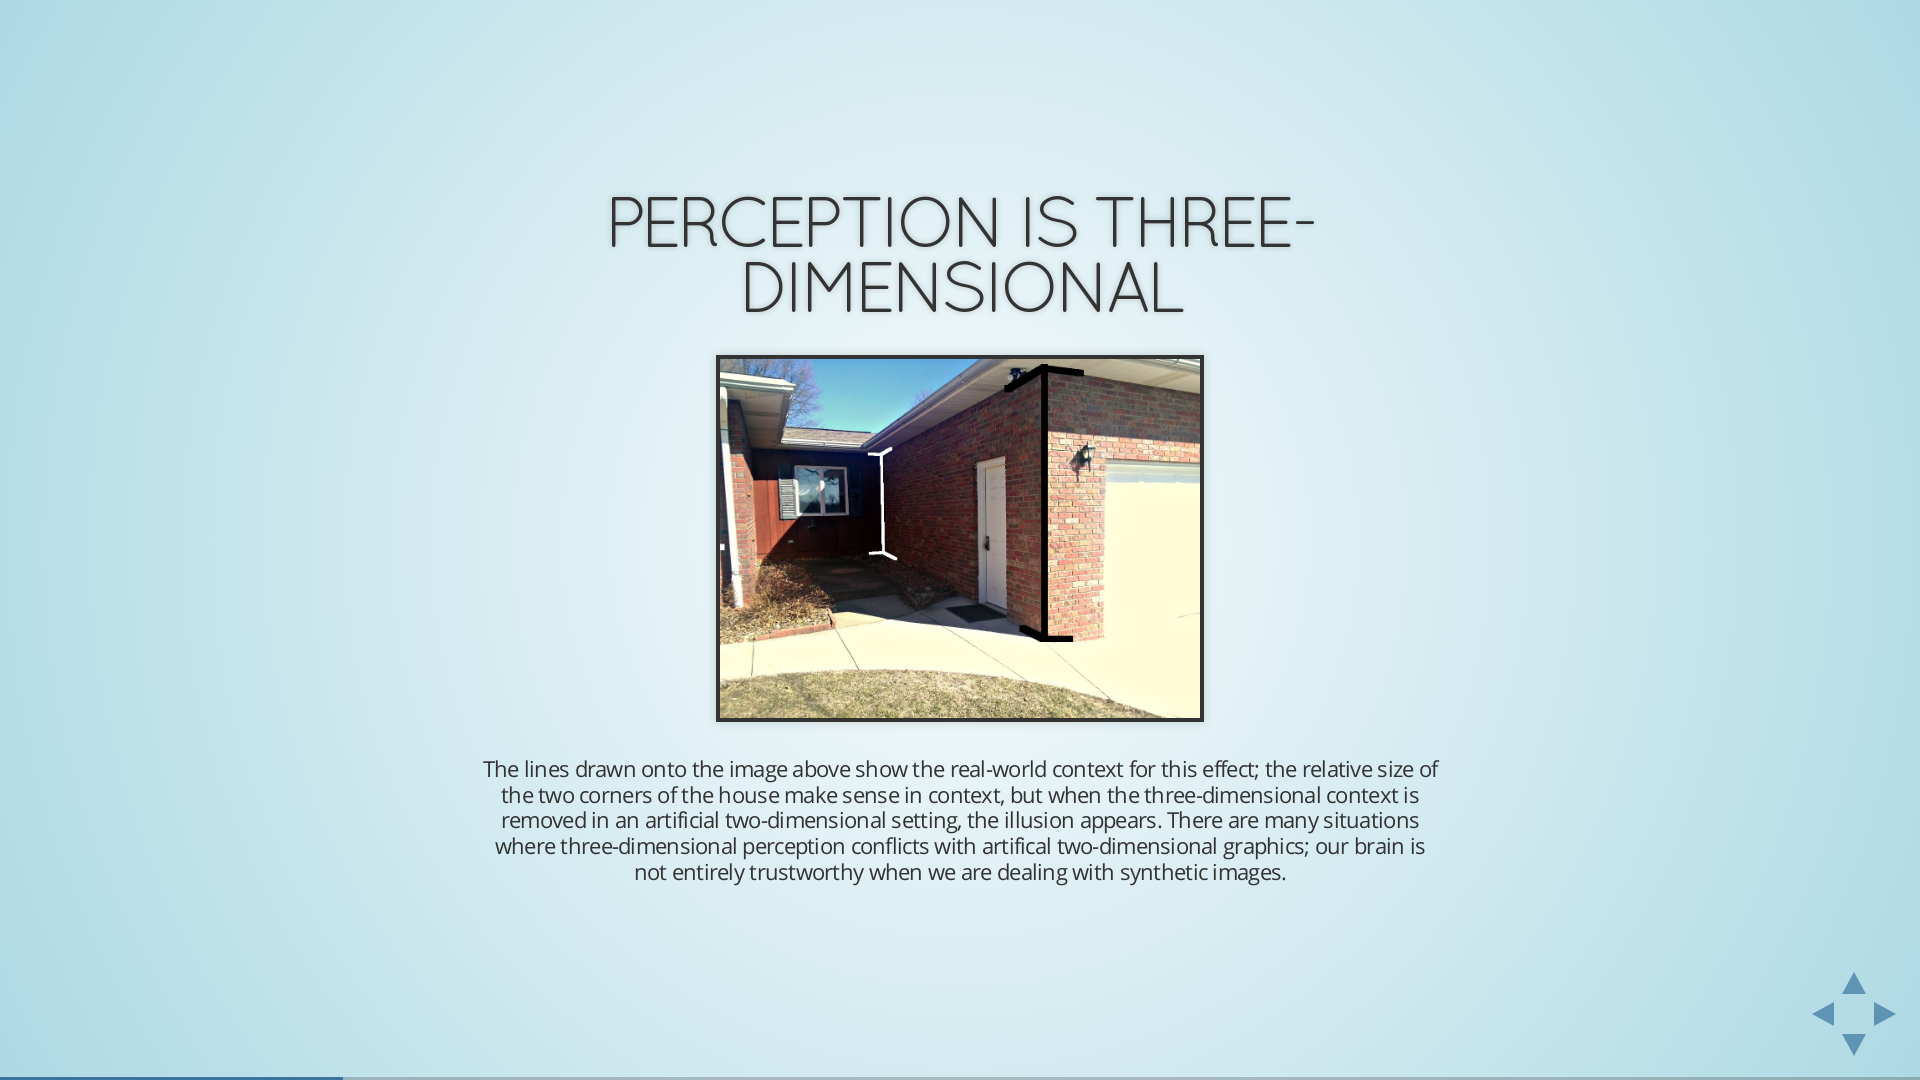
The curse of three dimensions: Why your brain is lying to you
talks
One of the basic principles of visual graphics is that the graphic should accurately reflect the data. Tufte’s lie factor was created with the idea that graphs that do not…
Aug 4, 2014
Susan Vanderplas, Heike Hofmann
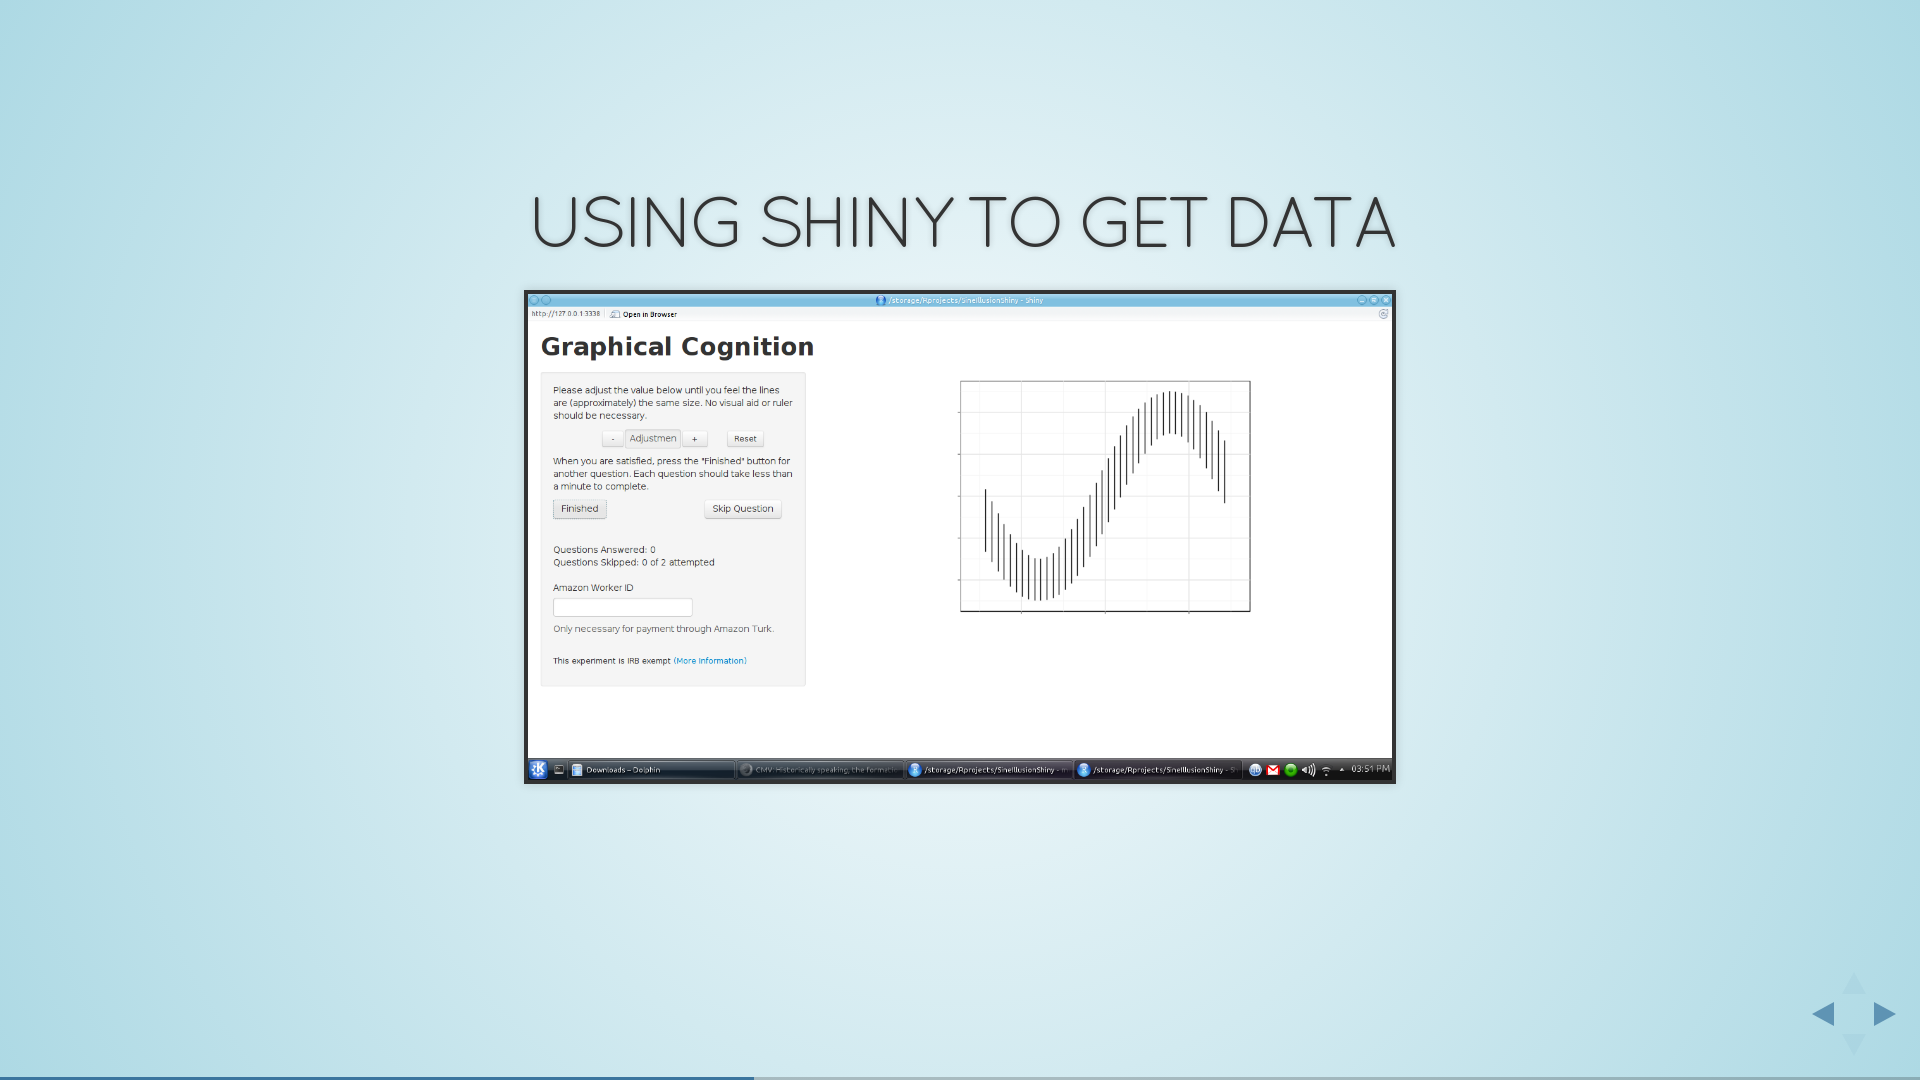
Do You See What I See? Using Shiny for User Testing
talks
NA
Aug 4, 2014
Susan Vanderplas
Animint: Interactive, Web-Ready Graphics with R
talks
NA
May 30, 2014
Susan Vanderplas, Heike Hofmann
Signs of the Sine Illusion – why we need to care
talks
NA
Aug 7, 2013
Susan Vanderplas, Heike Hofmann
In tennis, do smashes win matches?
papers
It is summer, and Wimbledon and the French and US Opens are with us. In tennis, does the man with the fastest serve win? And can you make too few unforced errors for…
Jun 13, 2013
Sarah Budrus, Susan Vanderplas, Dianne Cook
Detection of gene orthology from gene co-expression and protein interaction networks
papers
[1] F. Towfic, S. Vanderplas, C. A. Oliver, et al. “Detection of gene orthology from gene co-expression and protein interaction networks”. In:
BMC bioinformatics
11.Suppl 3…
Apr 29, 2010
Fadi Towfic, Susan Vanderplas, Casey A Oliver, Oliver Couture, Christopher K Tuggle, M Heather West Greenlee, Vasant Honavar
Near-infrared spectroscopy and cortical responses to speech production
papers
This research demonstrates near-infrared spectroscopy (NIRS) as a flexible methodology for measuring cortical activity during overt speech production while avoiding some…
Apr 3, 2009
Rachel Hull, Heather Bortfeld, Susan Koons
No matching items