| Unit | Size | Status |
|---|---|---|
| Broadcasting | 4 | |
| Community and Regional Planning | 4 | Eliminate |
| Landscape Architecture Program | 5 | Eliminate |
| Interior Design | 6 | |
| News and Editorial | 7 | |
| Classics and Religious Studies | 8 | |
| Communication Studies | 8 | |
| Textiles, Merchandising, and Fashion Design | 8 | Eliminate |
| Agricultural Leadership, Education and Communication | 10 | Combine (1) |
| Educational Administration | 10 | Eliminate |
| Philosophy | 10 | |
| Accountancy | 11 | |
| Advertising | 11 | |
| Marketing | 11 | |
| Architecture | 13 | |
| Chemical and Biomolecular Engineering | 13 | |
| Global Integrative Studies | 13 | |
| Sociology | 13 | |
| Statistics | 13 | Eliminate |
| Nutrition and Health Sciences | 14 | |
| Theatre and Film, Johnny Carson | 14 | |
| Modern Languages and Literatures | 15 | |
| Economics | 16 | |
| Finance | 16 | |
| Supply Chain Management and Analytics | 16 | |
| Earth and Atmospheric Sciences | 18 | Eliminate |
| Management | 18 | |
| Plant Pathology | 18 | Combine (2) |
| Political Science | 18 | |
| Educational Psychology | 19 | |
| Entomology | 19 | Combine (2) |
| Child, Youth and Family Studies | 20 | |
| Teaching, Learning and Teacher Education | 21 | |
| Art, Art History and Design | 22 | |
| Chemistry | 22 | |
| Agricultural Economics | 23 | Combine (1) |
| Architectural Engineering | 24 | |
| Food Science and Technology | 24 | |
| History | 24 | |
| Special Education and Communication Disorders | 24 | |
| Biochemistry | 25 | |
| Veterinary Medicine and Biomedical Sciences | 27 | |
| Civil and Environmental Engineering | 28 | |
| Biological Systems Engineering | 30 | |
| Mathematics | 31 | |
| Mechanical and Materials Engineering | 32 | |
| Computing | 33 | |
| English | 33 | |
| Physics and Astronomy | 33 | |
| Psychology | 34 | |
| Animal Science | 37 | |
| Electrical and Computer Engineering | 38 | |
| Biological Sciences | 39 | |
| Music | 39 | |
| Natural Resources | 51 | |
| Agronomy and Horticulture | 57 |
Appendix B — Problems with the Analysis of Research and Teaching Data
B.1 Provision of Data and Interactive Consultation Process
APC Procedures Section 2.2:
Information used in the reallocation and reduction process must be made available to the budget planning participants and affected programs in a timely manner so that corrections and explanations can be made before it is released to the public.
APC Procedures Section 2.3:
The process shall ensure that administrators, faculty, students, and staff are consulted. A shared definition of the word “consultation” is essential to ensure there is ample opportunity for advice prior to recommendations being developed. Consultation is more than just giving and receiving information; it allows all parties the opportunity and the time necessary to explore and offer alternatives before administrative decisions are made. Deans, directors, chairs and heads shall follow procedures as stipulated in their college and unit bylaws and allow advice, input, and discussion by faculty, staff, and, to the extent appropriate, students prior to proposals being submitted by unit administrators. Such consultation is intended to give administrators, students, staff, and faculty an opportunity for substantive interactions that go beyond simply sharing information. One of the keys to the success of this process will be the manner with which the information considered at various stages is handled. In the early stages, it will be critical that those individuals responsible for developing budget reduction/reallocation proposals have an opportunity for candid discussions regarding the wide range of options open to them. Such candor is likely to occur only if participants are assured that the discussions will remain confidential. As the process moves forward and proposals are developed, it is essential that the scope of these working discussions expand to include units potentially affected by the proposals prior to public release.
Throughout this process, units have been unable to access the data used to compute the metrics. Some of the identified issues:
Some of the grant numbers used for Statistics seem to be incorrect (e.g. one faculty member brought in more than the total for the department over the period listed), but we have not been able to get the source numbers or computations from ORI.
The numbers for SCH seem to be off by a factor of 10 in 2020 relative to what they should be, across all departments.
The number of people in the department and apportionments listed do not match the ORI calculations for %FTE in e.g. research.
The department has made enquiries about these issues, but has not made any progress in making corrections to the metrics used.
The statistics department received their own metrics in June, but, without any contextual information, it is hard to interpret the values (even with the codebook). As any statistician knows, a single data point (particularly in a multi-dimensional domain) is useless; data gains power only through comparison to relevant reference distributions. The inability to consult with upper administration and to correct data and processes which are not reliable is critical to a fair budget process. The statistics department has been denied this chance.
In addition, it appears that the registrar and the graduate college have been instructed not to provide departments with any data related to the budget process. This creates an us-vs-them environment where departments proposed for elimination are frozen out of the university and not allowed to share in governance processes or counter the facts presented within the proposal. This is not how the APC process should unfold.
B.2 Data Quality
There are many data quality problems which were discovered after the Chancellor’s proposal but which have not been corrected. The poor data quality and documentation of the data used to assemble the quantitative metrics, and the reliance on this data in the face of identified data quality issues and systematic biases clearly indicates that the administration’s committment to metric-driven improvement is at best limited to metrics that can be easily pulled from databases with minimal quality control. However, it is difficult to verify or correct data quality issues without access to the full data, which has not been provided, as detailed in Section B.1.
A few documented issues with the data are worth a mention:
In Academic Analytics, 12 out of 1275 faculty at UNL have a degree year of 1900. Spot-checks of two of these faculty suggest that someone enterd the degree year as 19 when it should have been 2019. However, if there are any faculty at UNL who received their degrees in 1900, they would be particularly strong candidates for VSIP.
One faculty member in the statistics department was excluded from the analysis because their apportionment was incorrectly recorded by HR. This affects department productivity metrics as well as headcount calculations, but it also revealed differences between the budgeted salary information posted online in spreadsheet form, the information available in the PDF Personnel Rosters, and the information compiled by ORI. If departments cannot even determine how headcount was calculated, how are they supposed to correct errors in the calculations?
In Academic Analytics, TMFD’s comparison group was listed as “Consumer and Human Sciences, various”. Academic Analytics relies on the organization to submit the correct CIP code for the department, suggesting that someone at UNL entered the wrong CIP code. That this was not caught by ORI or another office involved in assembling the relevant data raises questions about the data validation process – or whether any data validation was performed at all.
We could not validate the grant numbers for our department, and confirmed with ORI that we did not have access to the necessary binary variable to replicate the ORI analysis – and ORI would not release the individual data that would allow us to validate the calculations as described. Attempts to replicate
total_sponsored_awards_inc_nuf_rsch_pub_serv_teach_avg_awards_budgetsuggest that there is either a problem with the data or the description of how the data was calculated:- If we multiply the 0.362 value for statistics (before it is converted to a z-score) by the state permanent budget from 2025-26 (just a rough estimate), we get $481185.24.
- A single PI in the department brought in 1.2 million dollars in grant money during the 2020-2024 period, but this variable does not appear to have been normalized by the number of FTE in the department (which is itself a potential explanation for the department size correlation).
- The total amount of grant money brought in over the 5 year period within the department suggests that the number was not normalized by the number of years either.
B.3 Analysis Method
This section has been written with an audience of non-quantitative individuals in mind. Those with mathematical or statistical training can find a more detailed explanation in Appendix C.
Moreover, it is clear that whoever designed the data reduction method used in this analysis had internalized the idea of variable standardization but was unfamiliar with the central goal of statistics: interpreting and understanding data within its real-world context. No amount of numerical sophistication will fix an underlying mismatch between the data which is available and the data needed to answer the question of interest. The questions of interest to UNL should be:
- “which departments perform well or poorly relative to their peers?” followed by
- “which departments have relatively little impact on other departments within the university and could thus be eliminated without cascading failures?”
Instead, the analysis focuses on identifying departments which are different from other departments at UNL across a variety of metrics intended for discipline-specific comparisons. It is reasonable, for instance, to compare the per-capita grant funding brought in by one Statistics department to the per-capita grant funding brought in by another Statistics department at a different university. It would even be reasonable to compute this quantity for many departments across the country and to assemble a distribution of values or rank the department of interest compared to its peers. However, apart from the SRI metric, which will be addressed separately, this is not what has been done, and it demonstrates a fundamental lack of understanding of the concept of a population:
a set of similar items or events which is of interest for some question or experiment. A statistical population can be a group of existing objects or a hypothetical and potentially infinite group of objects conceived as a generalization from experience. – Wikipedia, definition of “statistical population”
That is, whoever created the statistical analysis methodology did not account for the fact that all departments in the analysis are not similar. For instance, instructional metrics are computed without regard to whether a department offers service courses at the undergraduate or graduate level (and how many of those courses are offered or required by other departments). This leads to nonsensical comparisons, such as comparing the EDAD department, which is graduate-only and doesn’t have service courses, to the English department, which teaches courses at all levels and has many service courses and electives as part of its portfolio. Ultimately, it is not reasonable to expect that the EDAD department would offer undergraduate courses in educational administration, a field that requires a graduate degree (for good reason). Thus, it is also not reasonable to explicitly compare these departments and their constitutent programs and course offerings. As graduate students are only a fraction of the students on campus, it is not reasonable to compare SCH generated at the graduate level in one department to SCH generated at both undergraduate and graduate levels in others.
This problem persists across both research and teaching metrics. SRI, a measure created by Academic Analytics, is perhaps the exception to this rule, but only in that it accounts for discipline-specific norms with respect to research outputs. Unfortunately, UNL’s administration used a custom SRI value which compares UNL departments to public AAU institutions, and then took that value and used it to compare UNL departments to each other across discipline boundaries. Section B.4 has more detail on SRI, but the broader issue of comparing numbers across departments which are not fundamentally similar is pervasive throughout both the research and instructional metrics. For instance, grants in English are not similarly sized to those in Physics and Astronomy, Agronomy, or Engineering, because English professors typically do not require large amounts of expensive equipment to complete their research. As a result, it does not make sense to group these departments into the same distribution, which is what the analysis implicitly does by calculating a z-score for each variable.
There is also a clear relationship between the size of the department and its fate under the current budget proposal, as shown in Table B.1. Of the 6 programs proposed for elimination, 5 are in the smallest 10 departments on campus. This suggests that either the administration was specifically selecting small programs for elimination, or that the metrics used to identify candidates for elimination were biased against smaller departments, perhaps unintentionally.
Smaller departments can have higher variability in year-to-year grant awards, citation counts, and other productivity metrics. Instructional metrics can very easily be thrown off by faculty development or FMLA leave, which does not appear to be accounted for in the FTE metrics1 Small departments are also far more disrupted by turnover events, because one event in a unit of size 4 or 8 is a large proportion of the unit – and, given that research productivity metrics do not include faculty who have left the unit, a large loss in measured productivity.
The problems with the analysis do not stop with the idea of using the correct comparison group, the lack of consideration for variability in the size of the department. In the eagerness to create the right combination of values, the analyst conducting this analysis inadvertently did the statistical equivalent of dividing by zero. The resulting variables (this problem is found in both research and teaching metrics) would, statistically, have no estimable mean and infinite variance2 – which is not what you want if the next step is to take that variable and create a z-score. Ultimately, this z-score contains no information – but by then averaging it with the other research or teaching z-scores, all of the downstream calculations also contain no useful information.
We won’t bore you with the statistical proofs and properties, but this is ultimately just one smoking gun suggesting that the metrics used in the analysis are completely unreliable.
As this problem affects both the research and teaching metrics, it is the opinion of the department as statisticians (rather than as faculty whose jobs are on the line) that the analysis should be re-done in consultation with a professionally certified statistician (the P-Stat credential is issued by the American Statistical Association).
B.4 Use of Scholarly Research Index
B.4.1 Combination of Multiple SRI Values
Some departments have multiple SRI scores generated by Academic Analytics.
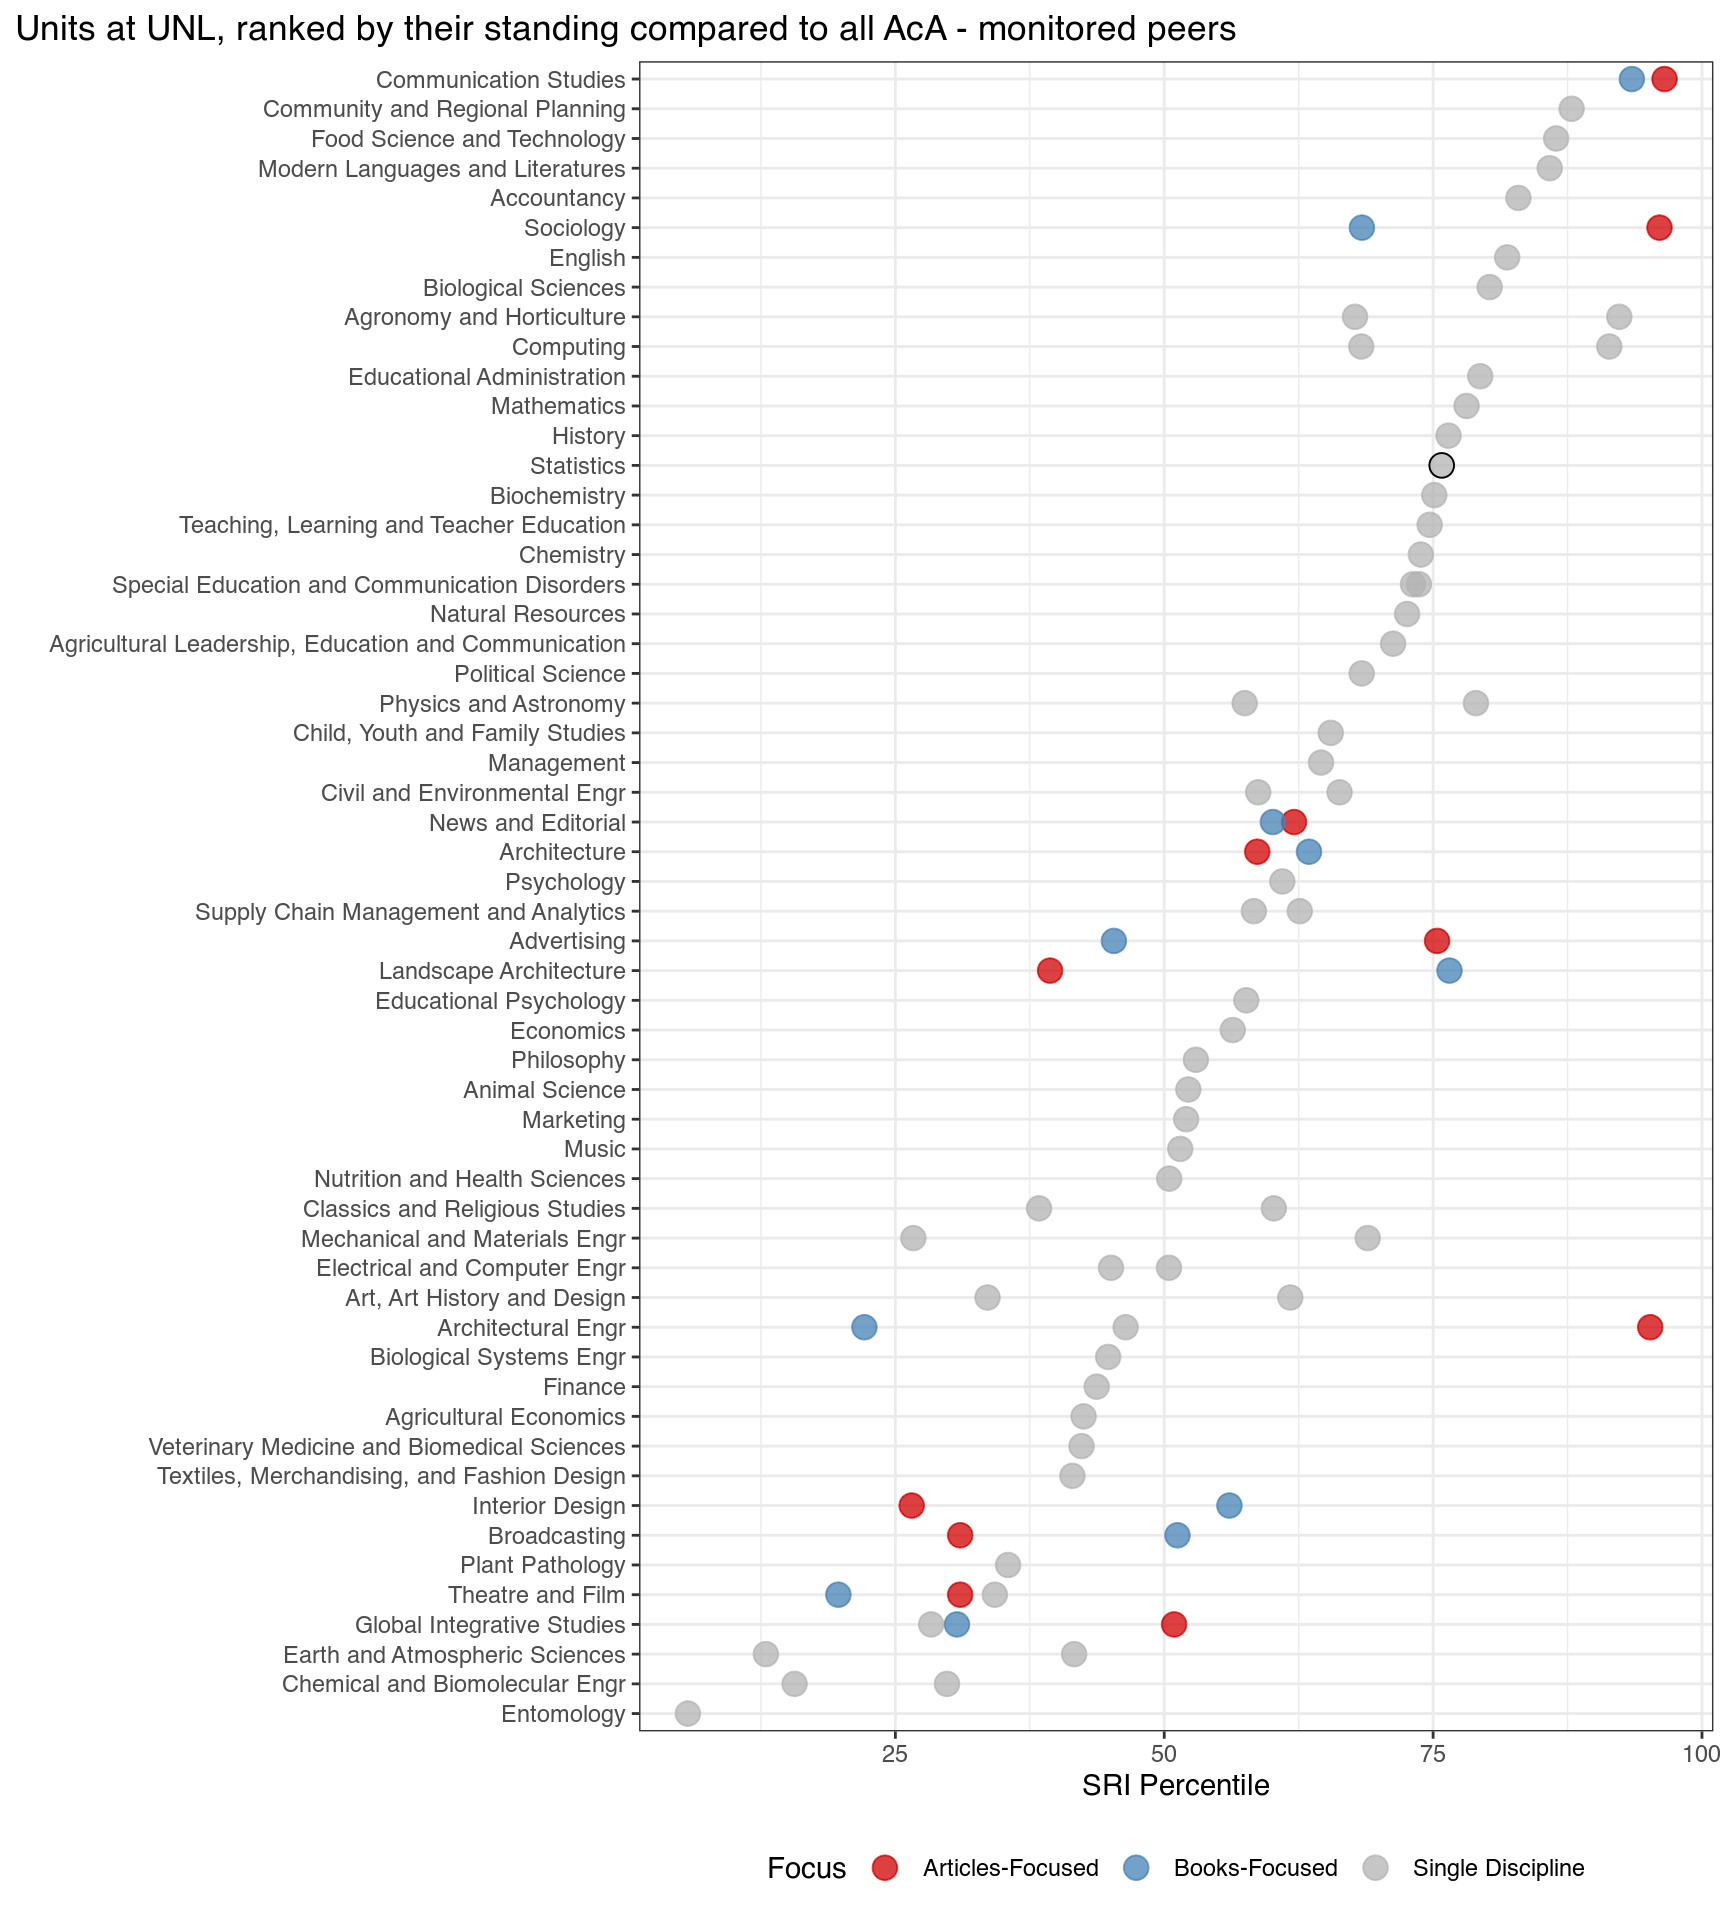
In some disciplines, departments might be book-focused or article focused, or might have members with different focuses. Examples in Figure B.1 include Communication Studies, Sociology, Advertising, Landscape Architecture, Interior Design, and Broadcasting, among others.
Another reason a department might have multiple SRI scores is that it is composed of multiple different disciplines. Examples in Figure B.1 include Agronomy & Horticulture, Earth and Atmospheric Sciences, the School of Computing, Physics and Astronomy, and Electrical and Computer Engineering.
When there are two different norms within a discipline, SRI scores were reportedly averaged to create a mean SRI value. This is incorrect - because these values have different distributions, averaging them does not produce a meaningful result with a valid comparison distribution. A more reasonable combination method would be to evaluate each score to get a distributional measure (quantile, percentile, rank), and then to take the maximum of that measure - the departments peers would know what the focus area of the department is and which focus would be more appropriate.
In the case of a hybrid department, the scores were also averaged. This approach is also not reasonable, as SRI distributions are not the same across disciplines. It is critically important to go through the distribution, calculating a rank, percentile, or quantile rather than using averages. Then, if the goal is to assess the department’s performance, two reasonable approaches could be used to aggregate the percentile or quantile scores:
- take a weighted average of the percentile or quantile scores, with weight determined by the composition of the department.
- take the maximum of the percentile or quantile scores in order to assess the overall opinion of the work done within the department in a community of peers. This makes more sense if the goal is to model how other people see UNL’s departments, as people tend to remember outstanding work in the field more than they remember or consider average work.
B.5 Problems with Overall Z-scores
The UNL research z-score is created by standardizing each input measure with respect to all departments on campus before computing an unweighted average of each component z-score to form a single research index for each department. This is fundamentally problematic, as the SRI measure used by academic analytics not only incorporates many of the components used (federal expenditures, awards, books, citations), but also because the discipline-specific weightings are intended to allow for comparison within-disciplines, and they are being used here as a cross-discipline comparison. That is, the z-score method indicates a fundamental misunderstanding of both the Academic Analytics (and AAU) metrics and the appropriate use of statistical methods. It would be quite reasonable to use the SRI percentile for each department, which compares the department’s research reputation relative to other departments in the same area, compute a normal quantile from the percentile, and then use that z-score to represent the department’s research reputation. This would also allow for use when averaging z-scores from other research metrics to produce a single research summary; which is a practice that is reductive and not particularly effective, but is also not definitively wrong.
More problematic is the use of standardization on variables that are ratios – in particular, those which might be expected to have a 0/0 form in distribution. That is, in both research and teaching, some quantity is observed at two different time points for a department and for the university as a whole. The difference between time points is then made into a ratio of department difference divided by university difference. Without strong assumptions about the increase in grant funding or instructional SCH, the reasonable way to model this quantity would be to assume that the mean at each time point is the same, leading to a 0/0 expected value (mean), which is undefined mathematically. This distribution has no mean and does not have finite variance, which is only complicated by the immediate standardization of these variables to create a z-score. Ultimately, this contaminates both instructional and research z-score averages, because everything this type of variable touches becomes not-estimable.
As a result, both the research and teaching z-scores are statistically meaningless - they do not provide any information on the departments, because of the properties of distributions which have no mean and no variance due to (essentially) dividing by zero. Relying on these metrics to inform decisions is fundamentally incorrect and essentially ensures the decision will be at best random, and at worst systematically biased.
B.6 Custom UNL Research Metrics
Moving past SRI, however, it is clear that there was some attempt to create a secondary SRI-like index with UNL data that accounts for some of the holes in Academic Analytics. There are many well known issues with Academic Analytics: only some journals are indexed, only NSF and NIH grants count for federal funding, excluding USDA, NIJ, DOE, NIST, and other sources of federally funded grant money, and only certain discipline-specific awards are counted as prestigious.
However, while UNL insists they did not weight the metrics used (as if that is an indication of unbiasedness), the number of variables measuring similar dimensions of research productivity certainly create an implicit weighting.
There are three different indicators of grant budget contributions. It’s unclear why the total_sponsored_awards_inc_nuf_rsch_pub_serv_teach_avg_awards_budget indicator was divided by total state appropriated budget, but the numbers for Statistics grants do not seem to be in the right ballpark. For instance, if we multiply the 0.362 value for statistics (before it is converted to a z-score) by the state permanent budget from 2025-26, we get 4.8118524^{5}. One PI in the department brought in 1.2 million dollars in grant money during the 2020-2024 period, so we can .
research_awards_growth_inc_nuf_fy20_fy24 looks at the percentage of growth of grant money attributable to the unit. Given that the grant totals are unreliable, it isn’t surprising that this percentage is also off, but the fact that the statistics department number is -455843.15 suggests that this isn’t a percentage at all and that there are some fundamentally problematic calculation errors (or the codebook is wrong, which also seems possible, particularly given the duplication of the entries for the last two research metrics).
p1_expenditures_normalized seems to include some of the information in total_sponsored_awards_inc_nuf_rsch_pub_serv_teach_avg_awards_budget, which would double-count the awards from NSF and NIH indexed by Academic Analytics (in addition to counting them a third fractional time via SRI). However, again, these numbers do not seem to be calculated as described. We cannot find any evidence of accounting for faculty members with secondary appointments in the department, nor can we make the numbers generated for Statistics make sense given our self-reported data.
awards_normalized would be directly reported by Academic Analytics and is already accounted for in the SRI metric. It is clear that the codebook was not checked for correctness by administration, either, given that the normalization is reported twice - it is unclear whether we to calculate this by dividing by the squared TT-FTE metric or by just the number of TT FTEs in the department. This metric is likely to be highly influenced by time in role and years since Ph.D., disadvantaging departments which are relatively young compared to those with a higher percentage of full professors. It should also be noted that not all professional organization awards are indexed by Academic Analytics, which represents a systematic bias when this metric is used to compare across departments and disciplines.
books_normalized is again Academic Analytics data that has been factored into SRI already. This data is publisher reported, and not always correct (one member of our department had the 2nd edition of his book reported as having the year of the first edition, so it just doesn’t count). As some disciplines do not preference books and instead publish articles or conference papers, using this metric to compare across disciplines (via z-score calculation) is absolutely preferencing book-focused departments.
citations_normalized has the same description as books_normalized; however, the numbers are not the same, so we presume this also uses Academic Analytics data for citations. Going into Academic Analytics, the citation data appears to include citations from journals which Acad Analytics indexes to journals which Acad. Analytics indexes, where the journal article was published between 2020 and 2023 and the citation occurred between 2020 and 2023. This is again a highly discipline-dependent metric – in fast-moving disciplines, such as Computer Science, a good paper will be cited many times within the first six months, while in slower disciplines, a paper might not be cited until 3 years later.
What is not included in UNL’s custom metrics is just as telling as what is included: they do NOT include any measure of articles published (beyond citations) and they don’t include any measures of conference papers published. This has the effect of biasing the metrics toward book-centric disciplines at the expense of article centric disciplines. When combined with the fact that grant award totals vary widely between disciplines (for instance, Statistics doesn’t require any lab equipment or supplies, so grants tend to fund students, travel, and summer salary), the metrics assembled by UNL are fundamentally unsuitable for cross-discipline comparisons. Pitting departments against each other using these metrics could be the result of a lack of understanding of statistics, or it could be that the metrics were assembled to produce a specific set of acceptable outcomes. In either case, however, it does not reflect particularly well on the UNL administration.
For instance, Dr. Vanderplas was on intermittent FMLA in Fall 2021 after having a baby. She taught a course because the department did not have enough FTE to teach the required courses (hence the “intermittent” FMLA), but the documented expectation was that research would not occur during the 12 weeks of FMLA leave.↩︎
Numerical data with this distribution can be averaged, but the average will not converge to anything as the number of observations increases – that is, there is no information that is gained from the averaging process.↩︎