4 Metrics
We begin this section by acknowledging that it is hard to assemble fully correct data that correctly represents our department, and that the task to assemble all of the (correct) data for all departments and stand-alone programs on campus is indeed a difficult one. We teach several courses in our department which describe how to build a data pipeline, from collection to cleaning to visualization, and we believe having a resource on campus which can consult on these tasks is fundamentally important to both the research and administration of the university. Our students are taught to consider the impact of the decisions which are made during assembly of a data pipeline when conducting the resulting statistical analysis and whether numbers are comparable and not an instance of “apples” to “oranges”; it is this step that is most obviously missing from the metrics provided to APC to justify the budget reduction plan.
The department would be more than happy to assist with future projects evaluating the performance of units across campus; integrating the methodology and data into a course as a service learning opportunity would have very real benefits. This data is both extremely interesting and provides an excellent demonstration of the importance of a variety of concepts from data documentation to reproducibility and the different varieties of messy data which often appear in real-world analyses.
However, we would be remiss if we did not note that administration has access to resources which have not been made available to departments seeking to understand how the relevant metrics were assembled. Ultimately, these issues are not particularly relevant to the importance of the Statistics department within the University of Nebraska ecosystem, and so we will defer discussion of most of the issues1 to Appendix B, which documents issues with the data itself, and Appendix C, which documents issues with the way variables were assembled and calculated.
Evaluation Metrics. As a social scientist who regularly constructs and evaluates composite indicators, I am dismayed by the metrics being used to evaluate programs during this budget reduction process. These metrics are inherently and irreparably flawed in their conceptualization, operationalization, and measurement. The inconsistent time frames across individual variables, the lack of weighting for different indicators, and discrepancies in the underlying data are just a few of the problems plaguing these metrics. These data are inadequate and misleading and should not be used for such high-stakes purposes, or, frankly, for any purpose.
Furthermore, this process has failed to engage experts on campus in identifying the individual metrics, operationalizing the variables, constructing the composite indicators, gathering the data, and analyzing and drawing conclusions from the data. This failure or unwillingness to engage with campus experts, including, most notably, faculty in the Department of Statistics who are now at risk of losing their jobs, is negligent. We all would take care to remember that quantitative metrics, if poorly conceived, are neither neutral nor “strategic.”… I encourage members of the APC and the Office of the Chancellor to draft and seek solutions that rely on accurate and well-conceived data, minimize disruptions to students’ degree completion and faculty members’ career paths, and ultimately break us out of this vicious cycle of continued budget reductions. – Courtney Hillebrecht, Ph.D., Chair and Professor, Department of Political Science
4.1 Research
We start by acknowledging that clearly, quantitative measures were important in the decision to propose the elimination of our department. However, that is not the only way to measure research effectiveness.
I have come to realize that working without expert statisticians is like trying to navigate a ship without a compass - the data may exist, but the path to meaningful conclusions is lost. Losing the Department of Statistics faculty would not only hinder these critical analyses but could compromise international collaborations and the opportunity to bring advanced phenotyping system to UNL, as the strength of these partnerships relies on statistical expertise. Beyond direct research collaborations, the departmental seminars have been invaluable for me as non-statisticians, providing the knowledge and confidence to apply statistical methods in my research and strengthen grant proposals. – Dr. Seema Sahay, Center for Plant Science Innovation
The Scholarly Research Index (SRI) is a measure developed by Academic Analytics to evaluate the research performance of individuals and entities with respect to (1) scholarly products, such as conference proceedings, research articles, books, and book chapters, (2) recognition from the community in form of citations and awards, and (3) federal sponsoring of research projects measured by the number of grants and their amounts.
Different disciplines operate differently. The weighting of each of these measures is discipline specific (based on a factor analysis by Academic Analytics); the weights for statistics are shown in Table 4.1.
| Category | Weight |
|---|---|
| Articles | 18 |
| Awards | 19 |
| Books | 5 |
| Chapters | 5 |
| Citations | 20 |
| Conf Procs | 11 |
| Grant $ | 22 |
| Patents | 0 |
| Trials | 0 |
| Total | 100 |
UNL Statistics has (based on data through December 2023) an SRI of 0.4 based on all R1 and R2 institutions tracked by Academic Analytics. Academic Analytics also offers the ability to compute an SRI based on a custom comparison group; using only AAU universities, the department’s custom SRI is -0.1.
Importantly, however, because SRI is the result of discipline-specific weights, it cannot be used as a faithful performance measure across disciplines directly. Each discipline has different distributional parameters (mean and standard deviation) for the SRI values. Comparing across disciplines without accounting for these distributional differences is not only incorrect but extremely misleading. Academic Analytics stresses the importance of using the SRI (and any other metric) only for comparisons within taxonomy peers. This is violated two-fold with the metrics used in the performance across units: departments are not at the same taxonomy level as stand-alone programs; and ‘peers’ are defined discipline specific. The document further elaborates the method for aggregating faculty within units. The key step here is to “Calculate each faculty member’s rank within the taxonomy, for each metric”. The discipline specific SRI rank is directly related to the SRI percentile.
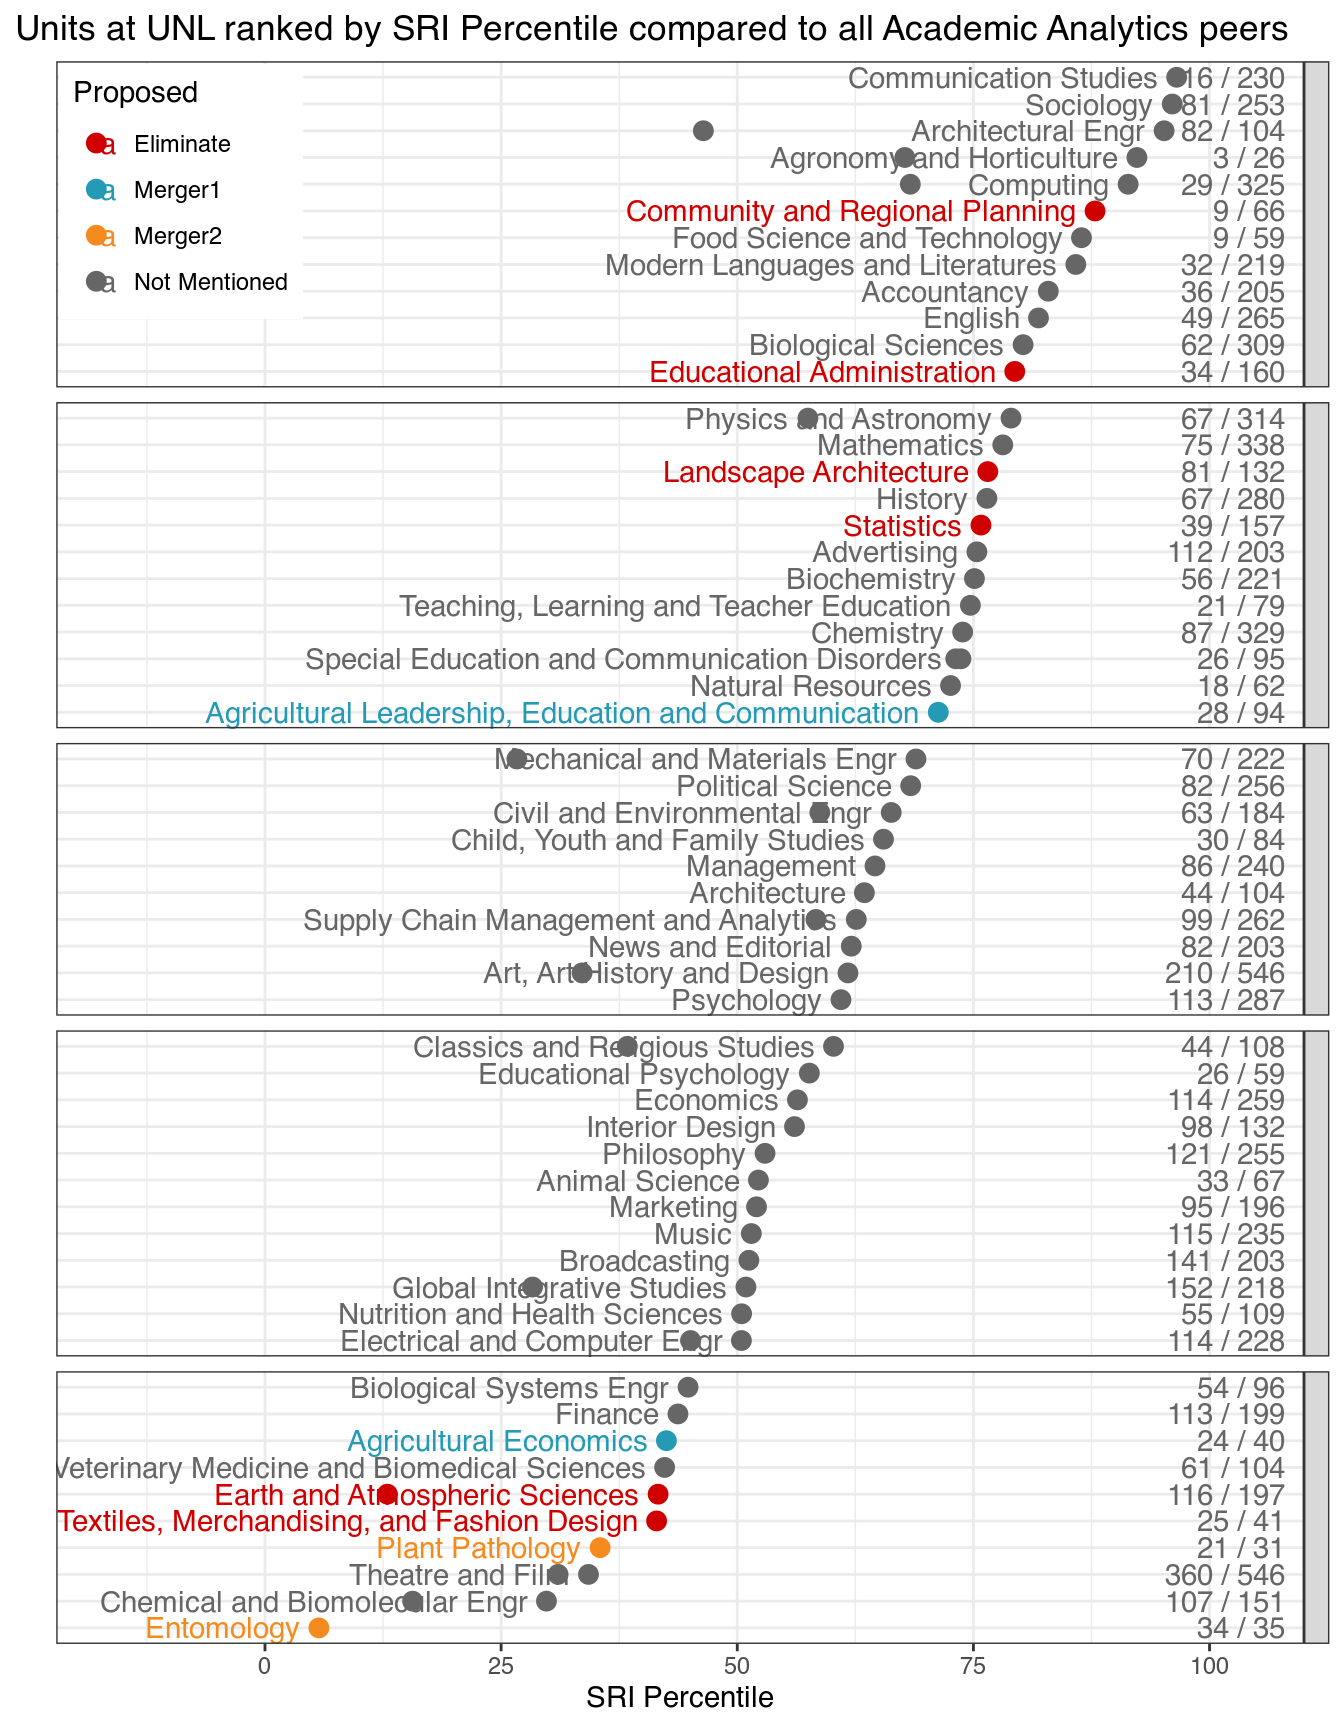
Figure 4.1 shows the SRI percentile for each department on campus when compared to other R1 and R2 departments. While several departments which have been proposed to be eliminated are indeed performing below the median, many departments are also above-average in their respective fields. We teach statistics students to carefully consider the appropriate comparison population and the real-world meaning of the numbers they use in analyses; it is important that UNL’s administration does the same. After all, it is less important that Statistics publishes the same amount of papers or generates the same amount of grant funding as Physics, because grants in those fields cover different things (statisticians don’t need particle accelerators very frequently) and publication norms are also different. What matters is whether departments are doing good work as measured by comparisons to the appropriate peers, both actual and aspirational.
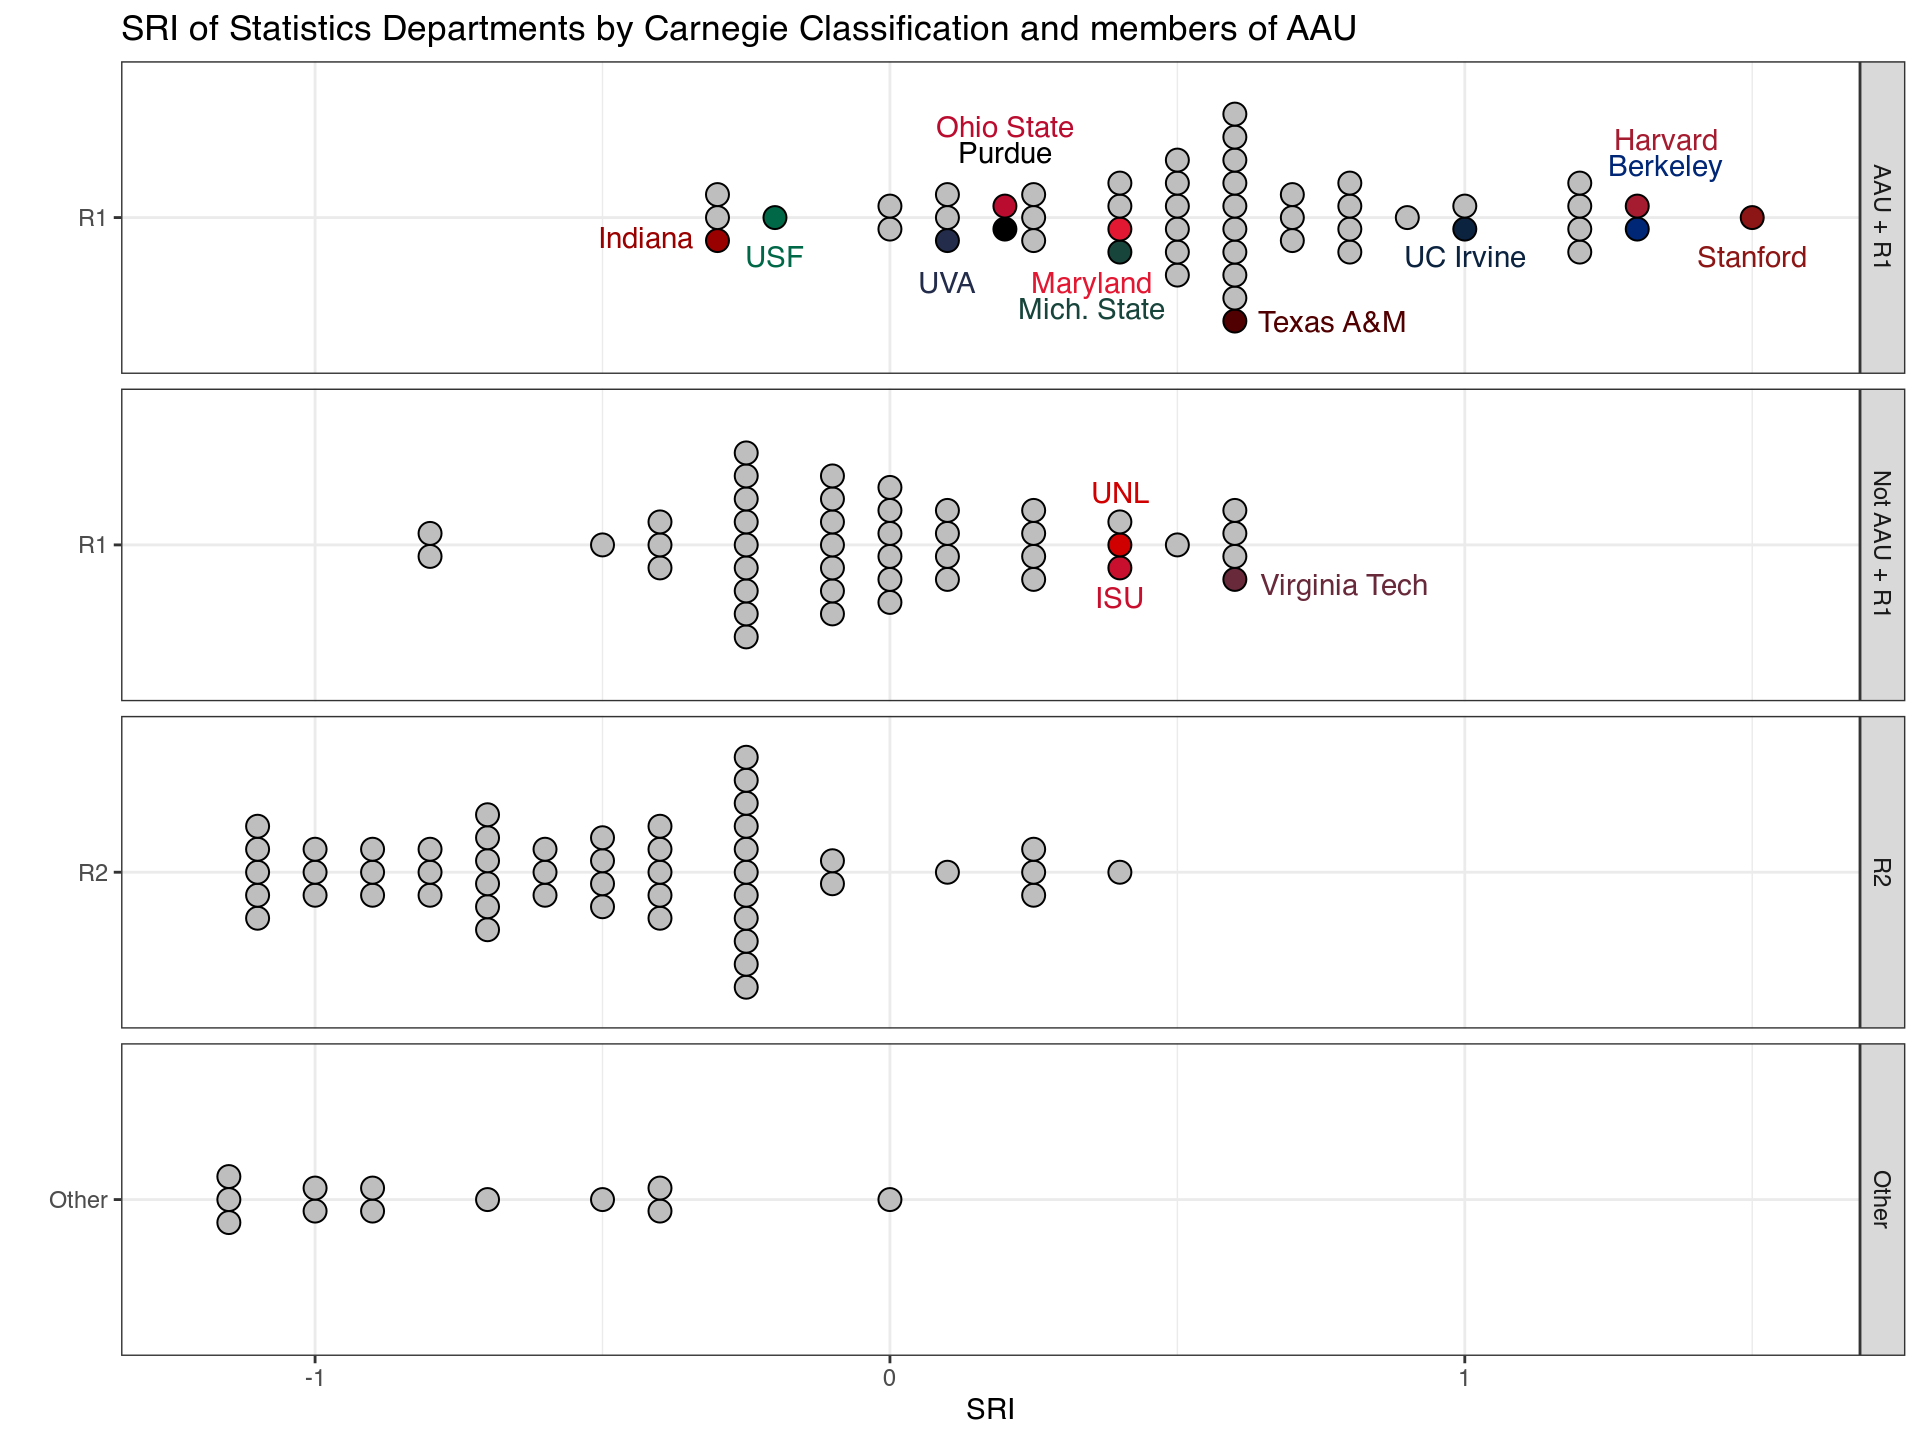
UNL’s ranking indicates that the Statistics department’s research productivity and recognition is better than 75% of other R1 and R2 institutions. Comparing the Statistics department’s SRI to other Statistics departments (Figure 4.2), it is clear that the UNL Statistics department performs better than several well-respected AAU and Big Ten institutions. If the Statistics department is eliminated, it is likely to hurt UNL’s case to be readmitted to the AAU, even though our SRI is below the mean for AAU institutions, because we are performing within the range expected of statistics departments at AAU institutions.
[Y]our statistics department is punching above its weight. Bertrand and Jennifer Clarke have written the bible on predictive statistics. When Covid-19 was at its height, Chris Bilder was advising the state of Nebraska on group testing, and his methodology was used. Bhaskar Bhattacharya has published seminal work in the Annals of Statistics, which is Holy Grail of mathematical statistics. Erin Blankenship is one of the world leaders in agricultural statistics. Heike Hofmann was recently hired from Iowa State, and she is a Fellow of the American Statistical Association, and there are several others in your department who outshine even her. – David Banks, Duke University Statistics Department, ASA Fellow, IMS Fellow, AAAS Fellow
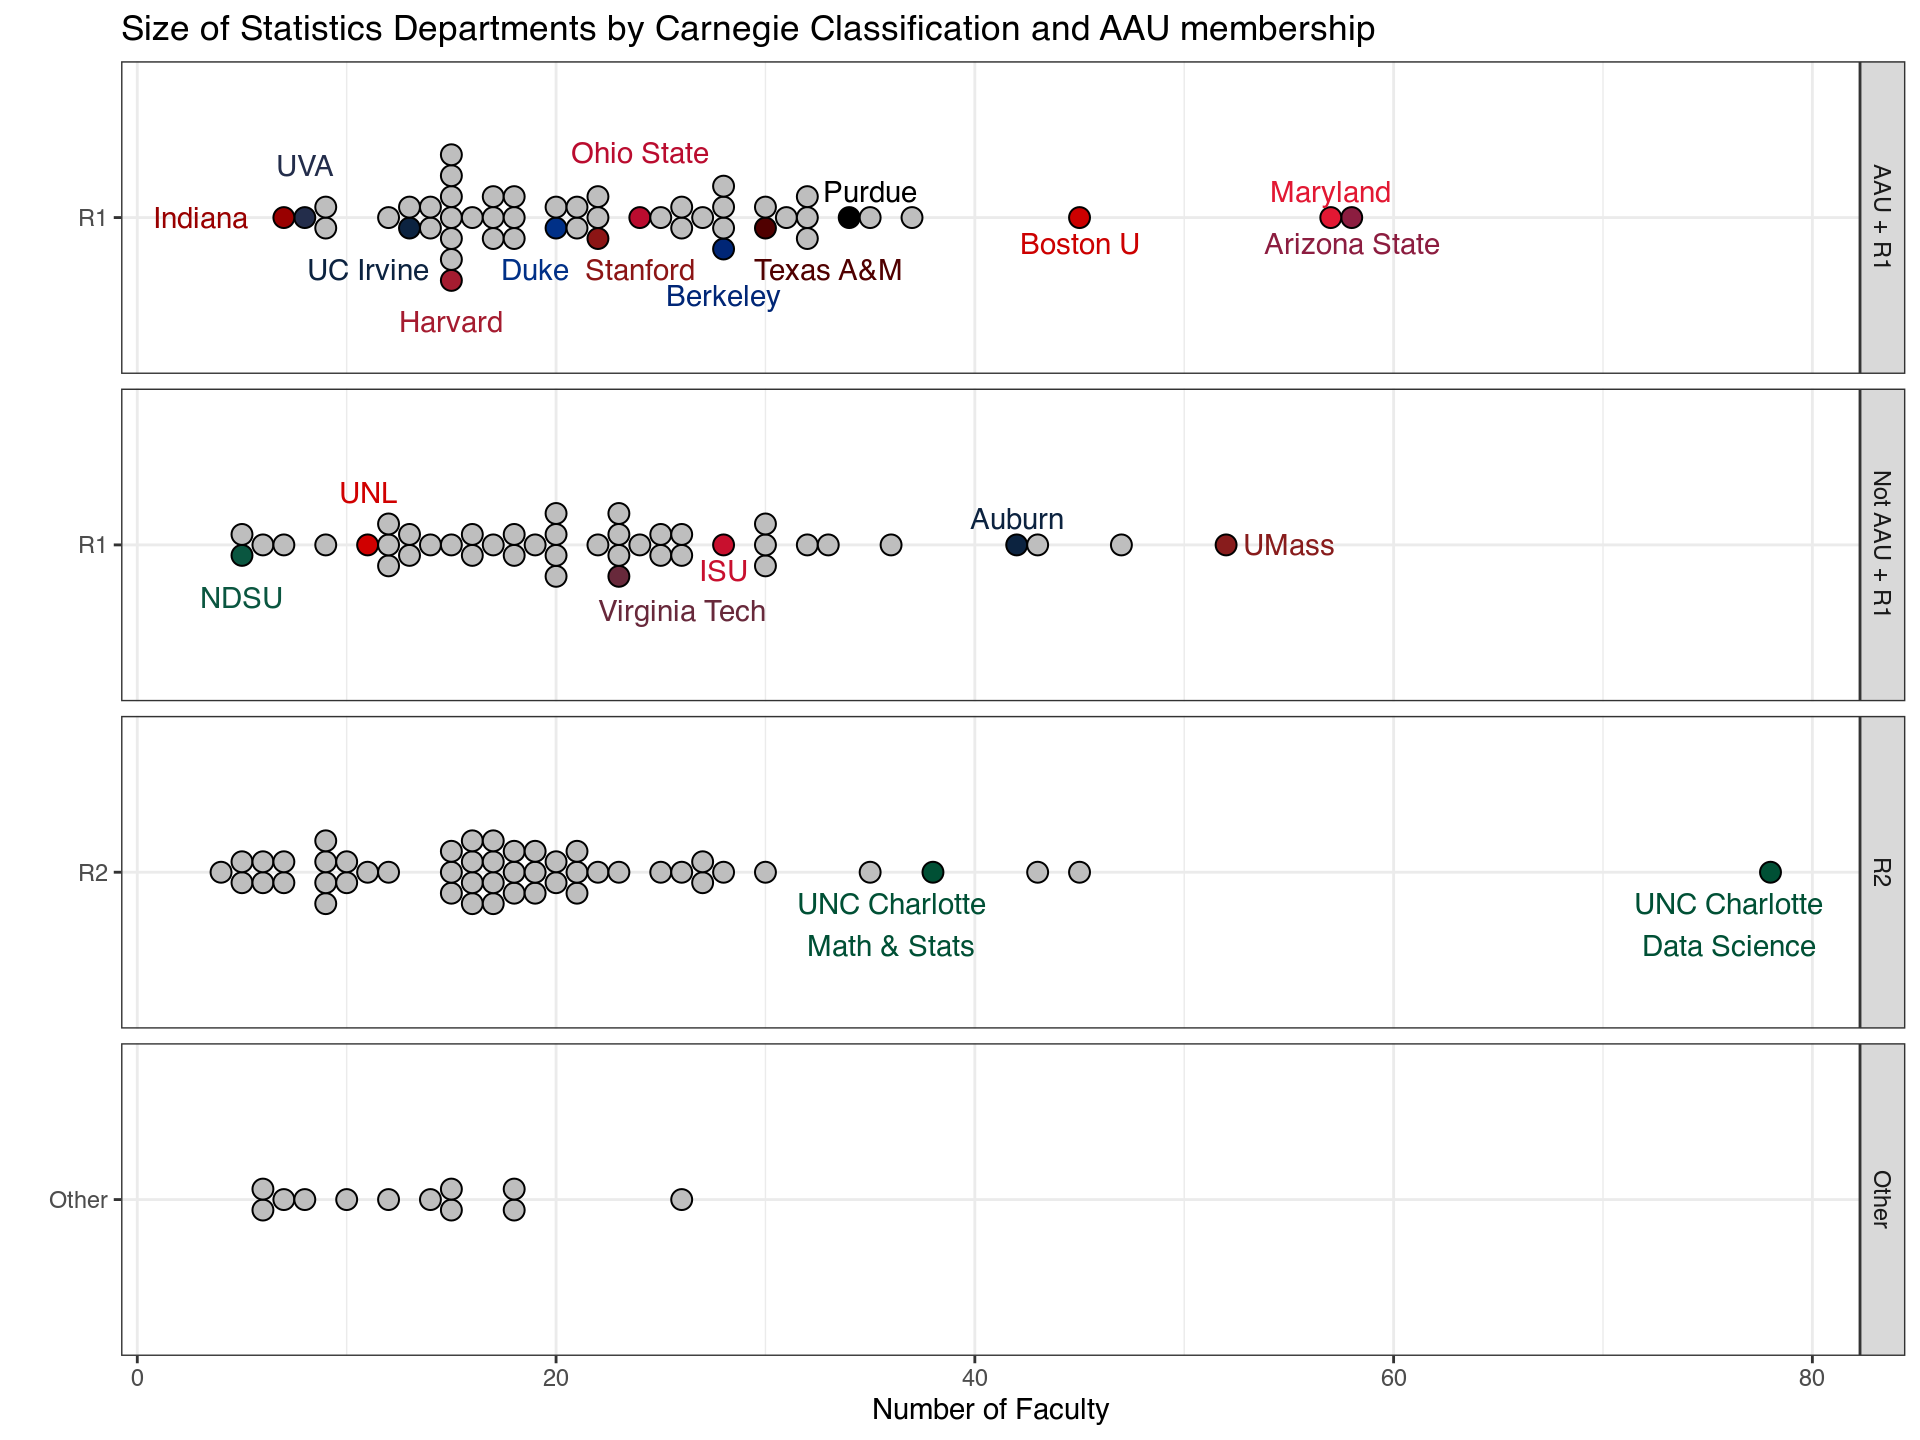
What is remarkable is that UNL does all of this with a department that is very small relative to its peers, as shown in Figure 4.3. It should be noted that UNL offers a full complement of statistics degrees and supports the data science program with this small faculty (13 tenure-track professors and a 30% FTE teaching professor of practice) while keeping research productivity high.
What’s more, it is possible to examine the shift between UNL’s custom SRI comparing institutions to public AAU institutions and the calculated SRI to determine the relative importance of a discipline to the AAU, as shown in Figure 4.4.
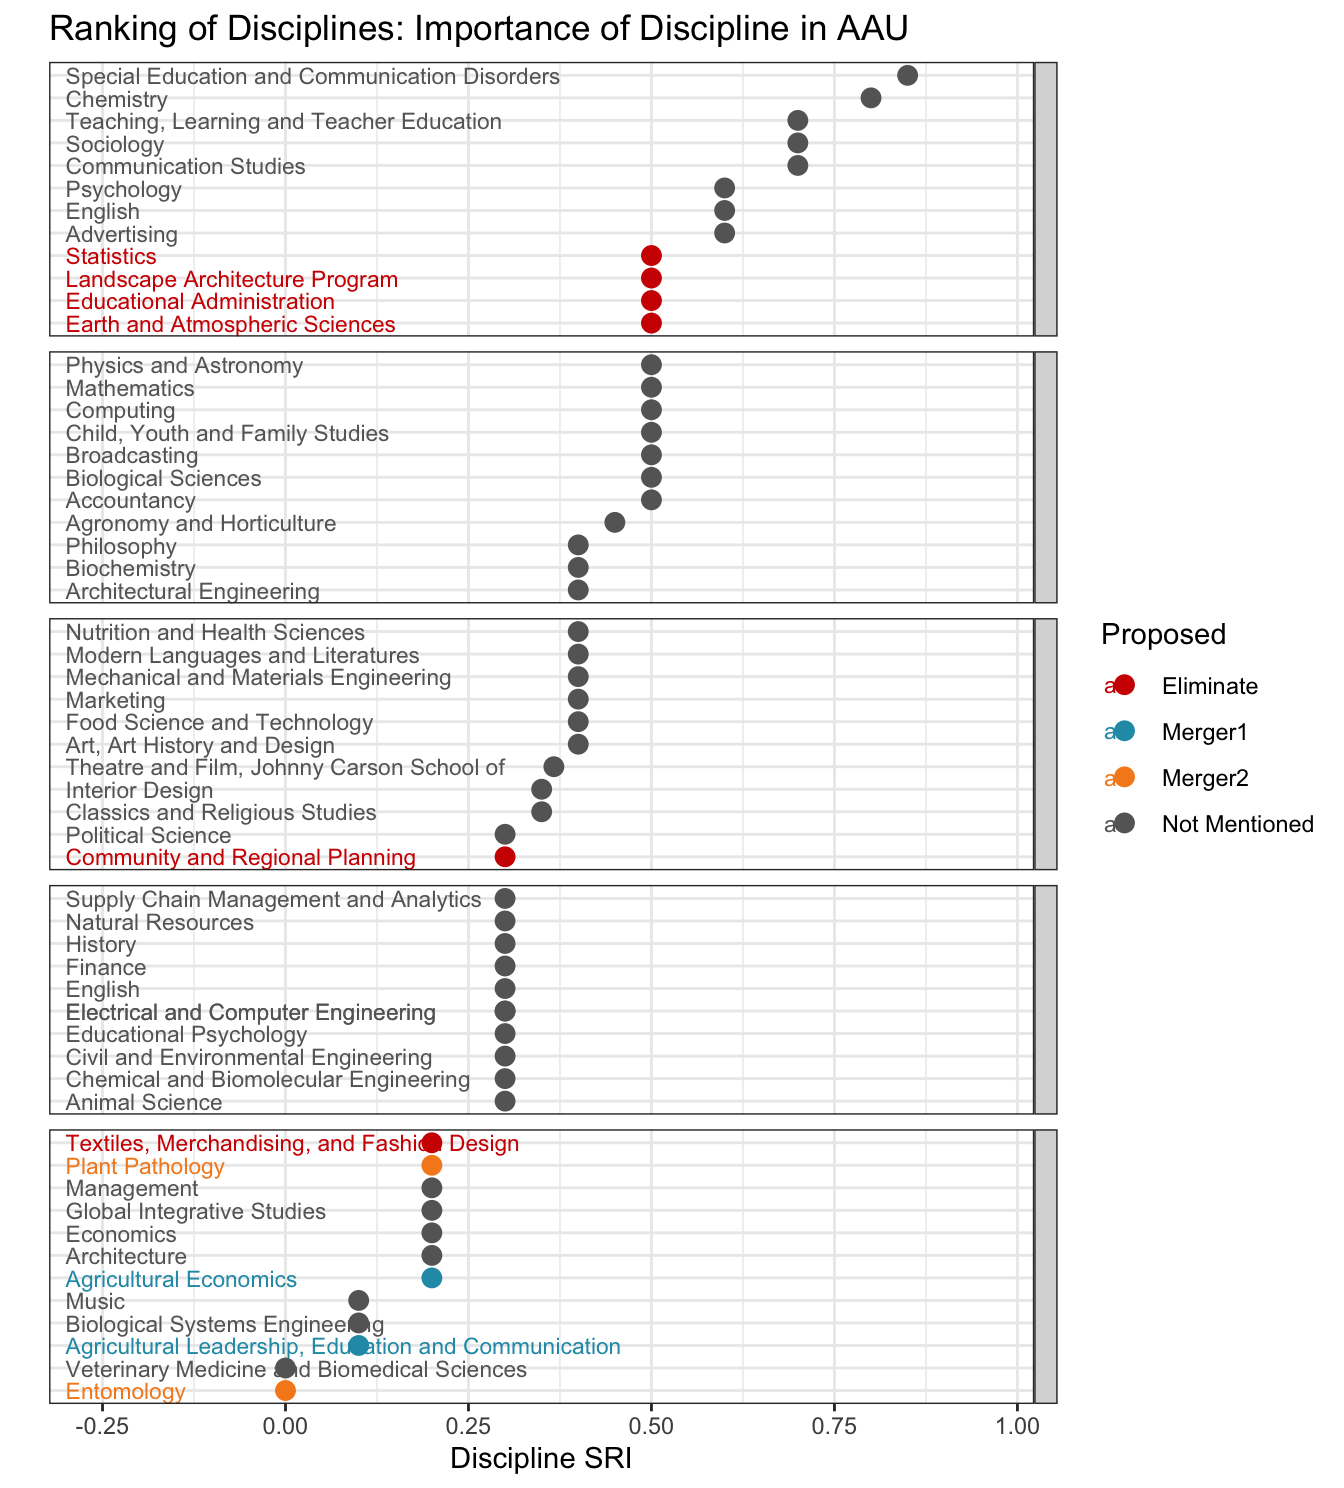
Disciplines which have higher SRI values within AAU public universities than within all departments nationally would naturally seem to be more critical to AAU admission than those whose mean/median SRI values do not change relative to the underlying population. That is, if knowing that a school is a public AAU institution provides a signal about the SRI of the department, then it is reasonable to conclude (practically, if not statistically) that there might be a relationship between that discipline and membership within the AAU. Several of the departments slated to be eliminated have high SRI differences when the AAU public filter is added, indicating that these departments are likely to be very important for AAU membership. While there is certainly some variability that might be due to comparison group size, for relatively common programs like Statistics, Earth & Atmospheric Sciences, and Educational Administration, this would seem to be an indication that eliminating these programs will damage UNL’s potential for getting back into the AAU.
A central development in scientific publishing and scientific procedure over the last century has been the onset of data rich studies and the deployment of concepts and tools involving rigorous statistical methodology for data analysis. These concepts and tools have largely been invented, carried out, promoted, and taught in statistics departments nationwide and worldwide. Today there are hundreds of thousands of papers yearly in clinical medicine and computational science that publish their results and clinch their arguments with statistical tests and procedures.
Although rigorous methods are demanding, difficult and in certain senses forbidding, they bring great benefits in terms of research efficiency. Instead of inconclusive research, in which we have no confidence, we get actual conclusions in which we have confidence. Still, some non-statisticians who have not been trained in these concepts and methods may not be aware of the threats to scientific validity which arise if the rigor is allowed to slip away. In fact, in the last decade we have become able to peruse the entire body of scientific literature as a dataset, and to recognize the uneven quality and rigor of studies, as well as the proliferation of poor studies, which contaminate the corpus and now begin to undermine public confidence and funding. – David Donoho, Professor of Statistics, Stanford University
4.2 Teaching
I strongly urge the Academic Planning Committee to … recognize that statistical education is not a “service” add-on but a foundational element in many academic disciplines, and a strategic asset for UNL and the State. – Professor Aemal Khattack, Civil and Electrical Engineering, UNL. Director, Mid-American Transportation Center
The Statistics department has high-SCH service courses, which the budget proposal recognizes and plans to continue. However, it is not clear how these courses will be taught - currently, they are taught by a combination of graduate students with training in statistics pedagogy and tenure-track faculty. The 1993 Biometry APR Self Study (pg 29) documented the challenges of appropriately staffing e.g. 801 and 802 labs when motivating their desire to start a Ph.D. program:
Enhanced teaching. Biometry has a number of classes with labs. We are constantly struggling to place graduate students with an appropriate background as lab instructors. For example, our M.S. students are required to take BIOM 802 (Experimental Design), which has a lab. They cannot teach the lab until they have had the course themselves… In general, Ph.D. level graduate students can make a variety of contributions to the teaching program that faculty do not have the time to make and M.S. students lack the background to make.
Section 8.2 estimates that at least 3 PoP positions would be required to maintain the 15 sections of 80 students in Stat 218 and additional sections of Stat 380, 801, 802, and 870 which would be maintained in the IANR proposal (approximately 25 sections per year). Keeping the sections of 318, 462, and 463 necessary to fulfill requirements in engineering and actuarial science programs would likely require an additional PoP, for a total of 4. Thus, the savings from the elimination of the statistics department are actually not nearly as high as expected: 4 FTE are required for teaching and 2 FTE are required for maintaining the SC3L, for a net of 7 FTE savings under the more specific details released by IANR on September 12.
Stat 218, 380, 801, and 802 regularly benefit from statistical research (for instance, an experiential learning activity in Stat 218 is used to introduce data visualization topics to students), and these benefits would disappear if all statistics coursework was offered by teaching-only professors of practice. However, this is not the only problem. Eliminating the many graduate courses we offer to both statistics and outside students would hurt researchers and graduate programs across the university.
Due to the development of specialized experimental designs in agriculture, we can rigorously analyze both field and greenhouse data to extract the most relevant and significant conclusions from our data. With the rise of large data sets, training in multivariate statistics has become essential. I cannot imagine a student of mine who is not trained in the statistical analysis of data. Statistical training has been an integral component for all students in my laboratory. Statistical analysis is a fundamental skill that every scientist needs to understand, both in academia and industry. – Dr. Daniel Schachtman, Center for Plant Sciences Innovation
The training that my students receive from the statistics faculty is essential for the design of experiments and evaluation of the significance of the result. It is the foundation to advance our knowledge of plant science that is the basis to improve agriculture production. Consequently, eliminating statistic department severely compromises our research competence that benefits Nebraska agriculture production. – Dr. Bin Yu, Center for Plant Sciences Innovation
Ultimately, the department’s teaching metrics are not representative of recent changes we have made in order to be more efficient and open our general education courses up to more students.
We have recently increased class sizes for Stat 218 from 30-45 students to 80 students per section. This change reduced the number of GTAs from 24 to 20, producing savings of approximately $200k. These changes were made in response to requests from IANR leadership as well as a desire to increase efficiency, but the change took time to implement: we had to work with scheduling on City campus to reserve larger lecture halls that are not as common on East campus. As a result, none of these changes are reflected in the metrics because data after 2024 is not included. Ultimately, our ability to increase instructional efficiency more is limited by the availability of large lecture halls that can accommodate 150+ students.
We began offering Stat 801 and 802 online in order to better support outstate students in various IANR programs, but this new modality has not been available for long enough to change enrollment metrics.
We also have great potential to open up and advertise other courses to departments across campus: Stat 850 and Stat 870 are both courses that should appeal to graduate students in many programs. In addition, it is quite likely that the number of SDAN majors will increase over the next several years, as we graduate our first cohort and have the ability to advertise their
Over the course of my education, I studied at multiple universities, but UNL was different. The Statistics Department stood out for its supportive faculty who invested in my growth as a researcher and professional. In particular, my advisor, Prof. Ghosh, provided mentorship and encouragement that shaped my life in ways no other institution did. I also want to acknowledge the immense support I received from UNL during the COVID-19 pandemic. That sense of care and community left a lasting impression on me and made me proud to be part of UNL. – Ramesh Aravind, Ph.D., UNL Statistics. Data Scientist, Travelers Insurance.
Current students in other disciplines recognize the importance of the department to both their education and their research.
As a PhD student in another department, I am disheartened by the committee’s recommendation to eliminate the Department of Statistics and I urge the committee to reconsider. The department plays an integral role in graduate-level education across disciplines. Elimination of the department means limiting enrollment options for students seeking to learn from statistics experts, while placing undue strain on the faculty who teach related coursework in applied disciplines. Further, the Department of Statistics actively supports the research interests of the university as a whole through direct instruction, extension, outreach, and consulting. For me, personally, the resources and support offered by the department have been indispensable as I work toward becoming an independent researcher in my field who is sufficiently versed in statistical analysis methods to conduct high-quality investigations. My work would not be as analytically rigorous without the guidance and teaching provided by the department, and I am certain this is true for other graduate students and faculty alike. UNL’s research activity, ability to attain grant funding via a variety of mechanisms, graduate student recruitment, and graduate level education standards will be dramatically impacted if the committee chooses to eliminate the Department of Statistics. – Caitlin Cloud, Doctoral Student, Sensorimotor Integration for Swallowing and Communication Laboratory, Department of Special Education and Communication Disorders
We should note that the use of in-major SCH to measure demand for the major is not ideal – for one thing, it is a real disadvantage to programs which are just getting started and don’t have a full set of 4 cohorts yet. It also assumes that students are perfect predictors of the economic demand for a skill, when students make decisions about which degree to pursue based on the “experience”. We strongly believe our program will be successful, but that it may need to be in a different college (and located on city campus) in order to be successful. The letters of support for our department suggest that many other schools have been able to make a statistics major profitable, suggesting UNL should explore other locations for the Statistics program before eliminating it entirely.
4.3 Consulting
In 1957, the seeds of the Statistics Department were planted with the founding of the Statistical Laboratory, which would provide statistical computing and consulting services to IANR. The consulting mission of the laboratory motivated the creation of the MS program in Biometry and the Ph.D. program in Statistics so that the department could meet more of the demand for statistical consultation and assistance with experimental design and statistical computing tasks.
…advanced graduate students can do routine statistical consulting on their own. This improves everybody’s access to statistical consulting and frees the faculty to concentrate on more difficult consulting problems. In Spring semester, 1993, Biometry instituted a “Help Desk” staffed by a graduate student. The response has been very good; she has been very busy with a variety of problems. - 1993 Biometry APR Self-Study, pg 29
It is important to note that even in 1993, it was clear that the 8 tenured or tenure-track faculty in Biometry could not meet the demand within IANR for statistical consulting.
Yet the demand for statistical consulting and collaborative research is extensive at IANR. Any compromise in the quality of service provided by Biometry would translate as an immediate loss in the quality and quantity of research possible at IANR. - 1993 Biometry APR Self-Study, pg 34
The current proposal maintains 1 FTE of the current 13 FTE in the Statistics department, which is well below even 1957 levels of funding and support.
| Department | 2020 | 2021 | 2022 | 2023 | 2024 | 2025 | Total |
|---|---|---|---|---|---|---|---|
| Agricultural Economics | 1 | 1 | 2 | 2 | 1 | 2 | 9 |
| Agricultural Leadership, Education and Communication | 1 | 1 | 1 | 2 | 2 | 7 | |
| Agronomy and Horticulture | 18 | 33 | 31 | 19 | 18 | 13 | 132 |
| Animal Science | 11 | 7 | 18 | 13 | 12 | 17 | 78 |
| Athletics | 1 | 1 | |||||
| Biochemistry | 2 | 1 | 1 | 4 | |||
| Biological Systems Engineering | 2 | 8 | 6 | 13 | 6 | 2 | 37 |
| Biology | 1 | 1 | 2 | ||||
| Biotechnology | 3 | 3 | |||||
| Birth Outcomes and Water Research | 3 | 3 | |||||
| CAS | 1 | 1 | 2 | ||||
| CEHS | 1 | 1 | |||||
| Chemistry | 2 | 2 | |||||
| Civil and Environmental Engineering | 1 | 5 | 3 | 1 | 10 | ||
| Communication Studies | 1 | 2 | 1 | 4 | |||
| Computer Science and Engineering | 2 | 1 | 1 | 4 | |||
| Criminology and Criminal Justice | 1 | 1 | |||||
| CYAF | 1 | 1 | |||||
| Dental Hygiene | 24 | 19 | 18 | 15 | 15 | 14 | 105 |
| Earth & Atmospheric Sciences | 3 | 1 | 2 | 6 | |||
| EDPS | 1 | 2 | 1 | 4 | |||
| Education | 1 | 1 | |||||
| English | 1 | 1 | |||||
| Entomology | 14 | 27 | 18 | 16 | 8 | 6 | 89 |
| Environmental and Sustainability Studies | 3 | 3 | 1 | 1 | 8 | ||
| Food Science and Technology | 19 | 14 | 19 | 18 | 16 | 9 | 95 |
| Glenn Korff School of Music | 3 | 1 | 1 | 1 | 6 | ||
| Growth & Development | 2 | 1 | 3 | ||||
| Marketing | 1 | 1 | |||||
| Mathematics | 4 | 1 | 5 | ||||
| Mechanical | 1 | 3 | 1 | 5 | |||
| Music - Vocal Pedagogy | 1 | 1 | |||||
| National Drought Mitigation Center | 1 | 1 | |||||
| Nebraska Forest Service | 1 | 1 | |||||
| NeDNR - Water Planning Division | 1 | 1 | |||||
| Neurocarrus | 1 | 1 | |||||
| Nutrition and Health Sciences | 1 | 1 | 2 | ||||
| Office of Academic and Student Affairs | 1 | 1 | |||||
| Office of Research | 1 | 1 | |||||
| Oral Radiology | 1 | 1 | |||||
| Panhandle Research and Extension Center | 1 | 1 | 2 | ||||
| Philosophy | 1 | 1 | |||||
| Physics | 1 | 1 | |||||
| Plant Pathology | 2 | 2 | 4 | 7 | 2 | 2 | 19 |
| Political Science | 1 | 1 | |||||
| Psychology | 1 | 1 | 2 | ||||
| Public Policy Center | 1 | 1 | |||||
| School of Biological Sciences | 1 | 5 | 1 | 1 | 2 | 10 | |
| School of Natural Resources | 9 | 7 | 6 | 18 | 5 | 8 | 53 |
| SGIS-Anthropology | 1 | 1 | |||||
| Sociology | 2 | 2 | |||||
| Southwest Fire and Rescue | 1 | 1 | |||||
| SVBMS | 1 | 4 | 5 | 1 | 2 | 3 | 16 |
| Testing Center | 4 | 4 | |||||
| Textile Science | 1 | 1 | |||||
| TLTE | 1 | 1 | 2 | ||||
| University Libraries | 1 | 1 | 2 | 1 | 5 | ||
| UNK Communication | 1 | 1 | |||||
| UNMC | 1 | 4 | 7 | 3 | 1 | 3 | 19 |
| Other | 1 | 2 | 1 | 4 | |||
| Total | 123 | 157 | 154 | 153 | 104 | 95 | 786 |
As Table 4.2 shows, the SC3L handles a large number of projects over the course of a single year. Many of these projects are graduate research in other departments, and result in publications which only sometimes include the SC3L consultant and only rarely include any Statistics faculty. These contributions to the research activity across the university and system are simply not counted in the metrics, as graduate student papers are not counted in the department’s metrics.
Moreover, Kathy Hanford, the head of the SC3L until her retirement in 2023, had a Professor of Practice position, which means her research outputs are not counted in the department’s contributions, both because she was not in a tenure-track position, and because she retired in December 2023 and was thus not in the department when the data were assembled.
Currently, the SC3L employs five graduate students for 20 hours a week each, though they generally work on SC3L projects more than the 20 hours/week required by their funding. There is no way that the single FTE dedicated to the SC3L under the current budget can manage this workload. In addition, under new rules imposed by IANR, this 100 hours per week (plus the SC3L director’s time) is devoted only to IANR projects. The demand for consulting services in other colleges and units is surely much higher! Chapter 9 discusses possible resolutions for the mismatch between IANR interests and the ability for all researchers at UNL to access statistical consulting services.
Historians have looked into the practice of statistical data analysis during that earlier era. For example, Stephen Stigler of University of Chicago has an excellent article called “The History of Statistics in 1933”. He showed that in those days there were earnest and hard-working data analysts who were not schooled in the kinds of patterns one might see in noisy data that had explainable causes recurring again and again from study to study. Instead, there was a great deal of wasted time and effort in those days, when people just didn’t understand what they were seeing. They either thought they were seeing something real that was only an artifact, or they were ignoring patterns and tendencies that were fundamental and very important but were overlooked through lack of the right tools or simple awareness. – David Donoho, Professor of Statistics, Stanford University
That our graduate students are the primary point of contact for many consulting projects hides quite a bit of collaborative and consulting work from the UNL metrics - often, it is the students who are co-authors on papers, and they do not show up in Academic Analytics. The plant pathology department (quickly aided by other departments on campus) set up a survey to demonstrate how many collaborations may not be present in the metrics; a spreadsheet with results can be found here. Without the graduate students supported by the SC3L, UNL risks publishing studies which are the product of faulty statistical analysis, or which employ sub-optimal experimental designs. This will slowly erode the reputation of other departments on campus, and will make UNL less competitive for federal funding.
Ultimately, reducing the consulting resources on campus threatens the ability of UNL to maintain its status as a Big Ten, land-grant, AAU-aspiring R1 university.
4.4 Collaboration
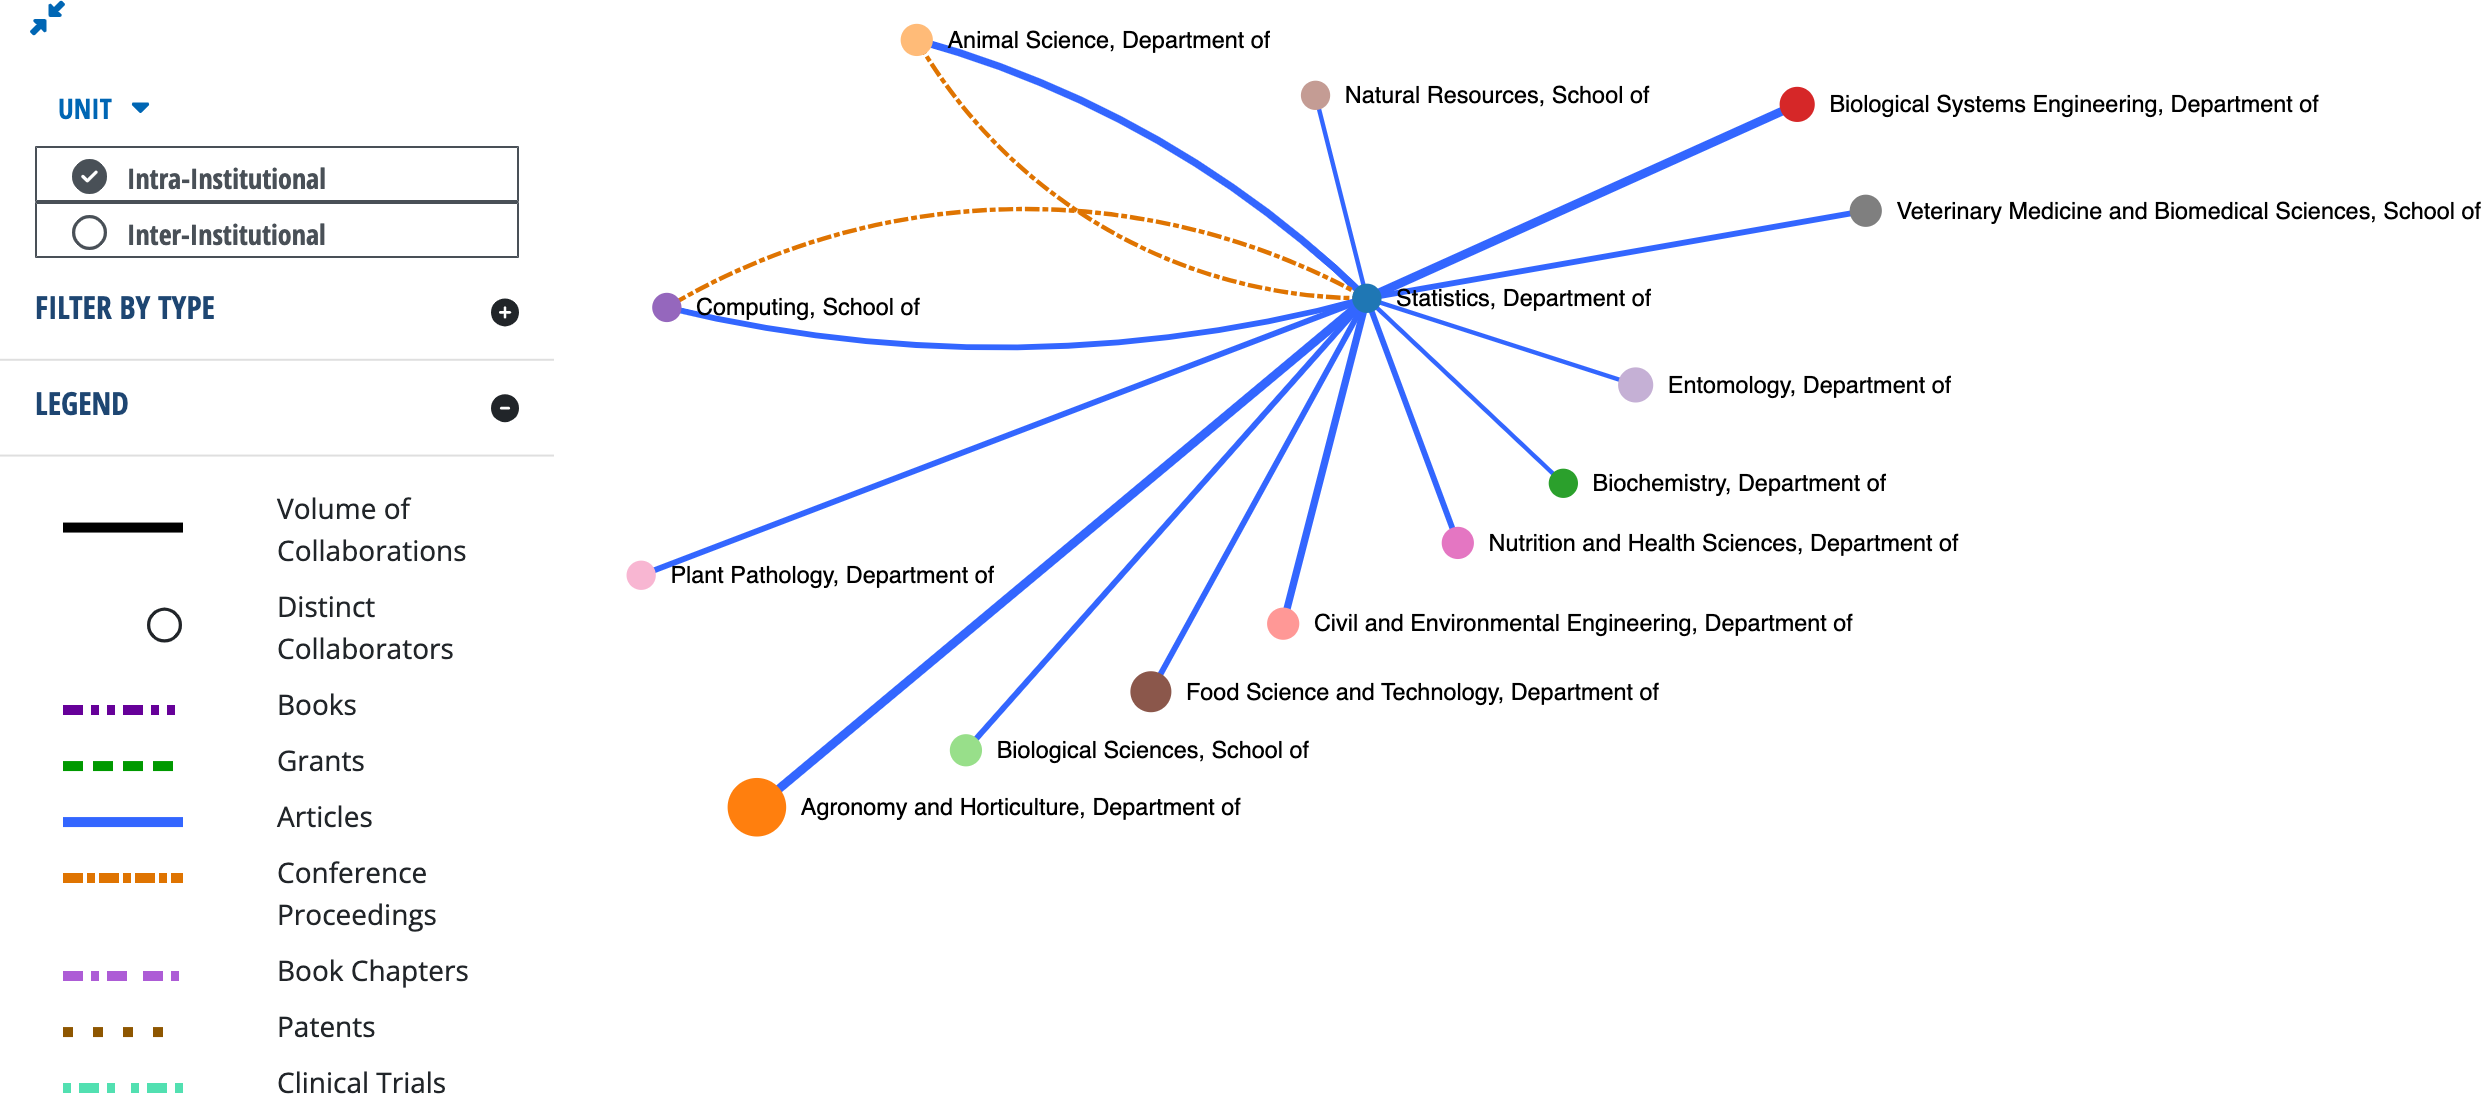
The Statistics department at UNL is currently well connected with other entities across UNL, mostly units on East Campus. Figure 4.5 shows a network of collaborations as recorded by Academic Analytics.
What is missing from this view are any collaborations with members of the Statistics Department who were not included in Academic Analytics by an oversight of the UNL administration. Faculty (Hanford, Stanke, Clarke) might not have a research component in Statistics, but their professional practice in Statistics enables researchers across campus to do their research.
The number of grants might seem low, but only grants with a non-zero dollar contribution to a Statistics faculty member are included. The mission of the Statistics Department has been to first and foremost serve the institution. As such we have agreed to be involved in grants without being officially acknowledged by receiving a non-zero percentage of the incentive, and in some cases, we are not even formally listed on the grants. Statistics faculty are also often involved by advising joint students, which is not documented in any of the metrics, though presumably that data is available to administration.
The Cultivate ACCESS team successfully secured $750,000 in USDA funding, in part because of the strength Erin [Blankenship] brought to our proposals through her nationally recognized expertise in data science and statistics education.
Eliminating the Department of Statistics would have profound consequences for programs like ours. Without a home department, the university risks losing faculty who bring both technical knowledge and the ability to bridge disciplines. Erin’s work demonstrates the irreplaceable value of Statistics to interdisciplinary collaborations that directly serve students, strengthen teacher preparation, and enhance the university’s research and outreach mission.
We strongly urge you to preserve the Department of Statistics. Doing so ensures that the university can continue to deliver the kinds of student outcomes and external partnerships that are central to AAU priorities and to the university’s future success. – Cultivate ACCESS Leadership Team
Some of our department members have been told that the research done in statistics – that is, the research published in statistics journals, rather than domain journals – is no longer considered “in alignment” with IANR and possibly UNL strategic goals. There is a faulty assumption at the core of this idea – there is not a clear divide between statistics research and domain-specific consulting. The two co-evolve, as Statistics research is often the product of domain specific questions. There is a cross-pollination effect whereby consulting projects raise statistics questions that are more abstract, leading to a split where the domain-level project is solved first and the more abstract problem is solved later and published in Statistics. Then, the formal methodology in the statistics literature can be applied to other domains with similar problems and slight variations. This admittedly complex process takes time to bear fruit, which is why consulting relationships take time to build and evolve.
A university that considers statistical research as “not in alignment” with strategic goals will quickly (within 3-5 years) find itself behind in curriculum and statistical support to other fields. This will hamper recruiting of undergraduate and graduate students, research efforts, and recruitment of faculty within fields that depend on statistical expertise. Statistics is somewhat like sports medicine – an invisible discipline to spectators, but an essential component of an athletics department that wishes to keep athletes performing at peak levels.
The Department of Statistics is not an isolated entity; it is an indispensable partner for us and for many other departments on campus. … Instrumental for Research and Funding The success of our research and our ability to secure external funding are directly tied to the expertise of the Statistics department. Our faculty members have relied on this partnership to secure significant external grants, including multiple projects funded by the National Science Foundation (NSF). This is not a coincidence. Modern plant science is a data-intensive discipline, and robust statistical analysis is essential for designing experiments, interpreting complex datasets, and validating research findings. Without in-house statistical collaboration, our faculty’s ability to compete for large-scale federal funding—like that from the National Science Foundation (NSF)—would be severely diminished.
The department’s value extends beyond formal collaboration. The department is essential to the education of our STEM undergraduates and graduate students, as well as informal mentorship and collaboration that are vital for both new and established faculty. Dr. Nathan Butler: “I have not had the opportunity to formally collaborate with stats faculty but have had useful in-person conversations with Susan VanderPlas and Dixon Vimalajeewa towards addressing research problems I’m interested in as a new faculty member, Erin Blankenship for providing an essential course (STAT 801) for my first graduate student, and Jennifer Clarke for recruiting me to UNL as the Director of the Quantitative Life Science Initiative.” – Center for Plant Science Innovation
There is the perception that collaborations across units have suffered from the recent retirement of highly-collaborative faculty. The administration has (informally) expressed a wish to see more collaborations within the Statistics Department, and while we are cognizant of this, collaborations take time to build before any measurable outcomes (papers, grants, students) can be documented. There is always a replacement cycle in any ecosystem, and while it is true that some old-growth trees have recently fallen, there are many saplings growing quickly to take their place in the forest. All of the metrics used to analyze the department are lagging indicators – the work is done more than a year before the paper is officially published2 or the grant is submitted, and then there is another year or more before the product is officially documented by Academic Analytics.
UNL is large, and the East/City campus divide can make it difficult to find the right collaborators - while the UNL Statistics department has many people who are excellent in their niches, it can be hard for non-statisticians to determine which person has the right expertise for their project. It might be more effective for the administration to facilitate opportunities for new faculty to meet established researchers in other departments - “speed dating for statisticians?” to set up the right conditions for these interdisciplinary collaborations to grow and mature. Alternately, a Statistics department with resources and additional capacity might host these events ourselves.
With current staff and teaching commitments, any expansion of services is not reasonable. Any increase in one form of consulting or research activity will require either an increase in consulting resources or a reduction in some other activity. - 1993 Biometry APR Self-Study, pg 34
Not all identified issues are outlined in those sections, because our priority is in preserving our programs and department rather than engaging in pedantry. We have opted to save resources and only detail the worst offenses in the data analysis which resulted in our unit being targeted for elimination.↩︎
Some journals in Statistics have a backlog of 2-3 years after the paper is accepted before it appears in print!↩︎
Dr. Vanderplas has written legal briefs or consulted pro bono on for 11 cases across 10 jurisdictions since 2020, helping to overturn precedent for admissibility of forensic evidence on at least three occasions (legal proceedings move even slower than most peer review processes, so these collaborations take even more time to bear fruit).↩︎