| Rank | Dept | Ratio |
|---|---|---|
| 1 | Agricultural Leadership, Education and Communication | 8.802 |
| 2 | Glenn Korff School of Music | 8.375 |
| 3 | Broadcasting | 6.091 |
| 4 | Program in English as a Second Language | 6.000 |
| 5 | School of Global Integrative Studies | 5.729 |
| 6 | Textiles, Merchandising & Fashion Design | 5.479 |
| 7 | Johnny Carson School of Theatre & Film | 5.204 |
| 8 | Advertising & Public Relations | 4.915 |
| 9 | School of Biological Sciences | 4.698 |
| 10 | School of Art, Art History & Design | 4.548 |
| 11 | Journalism | 4.450 |
| 12 | Durham School of Architectural Engineering & Construction | 4.323 |
| 13 | Modern Languages & Literatures | 4.275 |
| 14 | Educational Administration | 4.187 |
| 15 | Classics & Religious Studies | 4.140 |
| … | ||
| 49 | Earth and Atmospheric Sciences | 1.847 |
| 50 | Mathematics | 1.844 |
| 51 | School of Veterinary Medicine and Biomedical Sciences | 1.797 |
| 52 | Chemistry | 1.658 |
| 53 | Statistics | 1.533 |
| 54 | Animal Science | 1.533 |
| 55 | Entomology | 1.484 |
| 56 | Biochemistry | 1.480 |
| 57 | Women’s & Gender Studies | 1.441 |
| 58 | Agricultural Economics | 1.236 |
| 59 | Physics & Astronomy | 0.821 |
| 60 | Plant Pathology | 0.537 |
| 61 | School of Natural Resources | 0.390 |
| 62 | Center on Children Families & the Law | 0.269 |
| 63 | School of Veterinary Medicine and Biomedical Sciences | 0.183 |
Appendix C — A Statistical Commentary on the Metric Inputs and Calculations
This section contains a reorganized version of the code book provided to departments. The code book describes how the various measures used to evaluate departments were assembled and calculated. Measure definitions have been rearranged to form coherent categories (the original document is difficult to follow in part because derivative measures are sometimes not close to their inputs).
Warning C.1
Comments on the validity of various measures are contained in highlighted blocks to differentiate them from the official metric definitions. In most cases, these comments are focused on the problems discovered by the Statistics department, however, it seems likely that most issues cut across many departments.
C.1 General Descriptors
C.1.1 Identifiers
1.1.1 lowest_level_key Numeric key of lowest level unit.
1.1.2 lowest_level_short_name Short name of lowest level unit.
1.1.3 lowest_level_name Full name of lowest level unit.
1.2 vcvp Vice Chancellor that unit belongs to: EVC or IANR.
1.3 college College for units that belong to a college.
1.4 department Department for units that belong to an academic department.
1.5 has_finance_org Indicator variable: 1 if the unit has a financial org, 0 otherwise.
1.6 has_acad_org Indicator variable: 1 if the unit has a academic org, 0 otherwise.
1.7 has_hr_org Indicator variable: 1 if the unit has a HR org, 0 otherwise.
1.8 acad_end_year Academic ending year. E.g., 2024 for 2023-2024 AY.
C.1.2 Budget
1.17 original_sa_budget Original state-aided budget (total). Original budget includes all permanent funding as of July 1. Temporary funding and cash carryforwards are excluded. This also shows up at Budget in final metrics.
1.18 original_sa_budget_gse Original state-aided budget with General State-Aided fund subtype.
1.19 original_sa_budget_dt Original state-aided budget with Differential Tuition fund subtype.
1.20 original_sa_budget_poe Original state-aided budget with Programs of Excellence fund subtype.
1.21 original_sa_budget_other Original state-aided budget with other fund subtypes, including Distance Education, Facilities & Administrative, Tobacco and etc.
1.32 teaching_outlay Appointment budgeted salary * appointment teaching apportionment (%) summed for unit.
1.95 instruction_budget Original state-aided budget multiplied by teaching fte as a percentage of total fte for unit.
1.33 research_outlay Appointment budgeted salary * appointment research apportionment (%) summed for unit.
1.96 research_budget Original state-aided budget multiplied by research fte as a percentage of total fte for unit.
1.34 service_outlay Appointment budgeted salary * appointment service apportionment (%) summed for unit.
1.97 service_budget Original state-aided budget multiplied by service fte as a percentage of total fte for unit.
1.35 extension_outlay Appointment budgeted salary * appointment extension apportionment (%) summed for unit.
1.98 extension_budget Original state-aided budget multiplied by extension fte as a percentage of total fte for unit.
1.36 admin_outlay Appointment budgeted salary * appointment administration apportionment (%) summed for unit.
1.99 admin_budget Original state-aided budget multiplied by admin fte as a percentage of total fte for unit.
1.72 budget_from_evc_file_state_appropriated_budget State-aided budget.
1.991 total_realizable_base_tuition_less_budget This is estimated by total_realizable_base_tuition (1.49) less original state-aided budget, apportioned for percent_teaching (also instruction_budget, see 1.95 above).
C.1.3 Appointments & Headcount
Warning C.2: Apportionment problem: Partial-year data not included
This information seems to have been assembled from a source that does not take into account mid-year hires. Susan Vanderplas started at UNL in January 2020 and has a 20% Extension appointment, so for the 2019-2020 academic year, she would have been paid for between 5 and 6 months, depending on how 9-month contracts are handled. The Details tab of the metrics show a 0.0 percent extension FTE appointment for 2020, with subsequent years matching the 0.200 in the appointment.
Warning C.3: Headcount problem: Lack of Public Data Confirmation
There is relatively little clarity to be had about how apportionment was counted in these metrics. The only public data available to us is the UN System Budget & Salary Information, which contains spreadsheets (“Budgeted Employees as of…”) and PDF documents (“University of Nebraska Salary Information”). Historical data is available.
The salary spreadsheets appear to show the cost distribution for a position (e.g. where the money comes from), but only when the position is more complicated than just having funding from multiple departments indicating a partial appointment, as shown in Figure C.1. This happens most frequently when someone has administrative responsibilities in addition to standard research or teaching responsibilities.

The PDF tables of salary information show a set of information that sometimes matches, but sometimes does not.
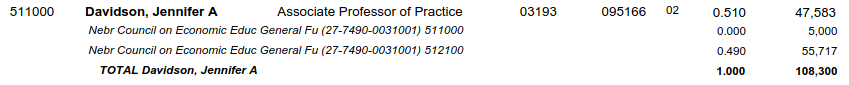
It seems likely that the proportions in the FTE column (next from the last) of Figure C.2 would represent the apportionment, but that doesn’t seem to always match what the individual understood their apportionment to be. When apportionments change, the university is supposed to provide written notice of the new contractual arrangement and it should be signed. In at least one case in Statistics, we could not find paperwork to match the effort allocation reported in the PDF FTE column. More importantly, however, it seems that the FTE column in the PDF doesn’t match the information assembled by the office of research and innovation to allocate research productivity to departments.
What this boils down to is that the Statistics department cannot get administration to explain why their numbers for people (and fractional people) in the department don’t match the administrations numbers. That is, we don’t even count department members the same way! Note that the individuals in question are longstanding members of the department who have e.g. taught Statistics courses, advised students, served on hiring committees - this issue spans most of the decade of research productivity metrics, and as a result, the impact cannot be assumed to be insignificant.
Perhaps if we could get data which matches our paperwork (if those columns exist in a database) and compare the different metrics, it would be possible to agree on a standard methodology for apportioning research productivity. These decisions happen in every data analysis, but we teach our students to (1) document the options which existed, (2) justify their selection of a particular option, and (3) conduct a sensitivity analysis after the analysis to see how much the results change based on the selection of a different way to measure a variable. The Office of Research and Innovation apparently did not do any of these things – and they also will not provide us with the data to validate their numbers ourselves.
1.9 appointment_apportionment_fte Total apportioned FTE across all appointments.
1.10 appointment_apportionment_percent_teaching_fte Sum of faculty teaching apportionment by appointment times FTE by unit.
1.11 appointment_apportionment_percent_research_fte Sum of faculty research apportionment by appointment times FTE by unit.
1.12 appointment_apportionment_percent_service_fte Sum of faculty service apportionment by appointment times FTE by unit.
1.13 appointment_apportionment_percent_extension_fte Sum of faculty extension apportionment by appointment times FTE by unit.
1.14 appointment_apportionment_percent_admin_fte Sum of faculty admin apportionment by appointment times FTE by unit.
1.15 total_instructor_fte Sum of appointment_apportionment_fte by unit.
Warning C.4: Instructor FTE Problem
This metric definition doesn’t make any sense. There is a single column of appointment_apportionment_fte for each unit.
If instead, this is intended to mean the sum of appointment_apportionment_percent_teaching_fte through appointment_apportionment_percent_admin_fte, it doesn’t make sense either, because those values should sum to appointment_apportionment_fte instead.
It is not clear what this is measuring, but departments which seem to have more extension-focused non-teaching appointments seem to be lower on the list. Departments which have more professors of practice seem to be higher on the list.
1.37 percent_teaching sum(appointment_apportionment_percent_teaching_fte) / sum(appointment_apportionment_fte) for unit. This is set to zero when there is no teaching apportionment.
1.38 percent_research sum(appointment_apportionment_percent_research_fte) / sum(appointment_apportionment_fte) for unit. This is set to zero when there is no research apportionment.
1.39 percent_service sum(appointment_apportionment_percent_service_fte) / sum(appointment_apportionment_fte) for unit. This is set to zero when there is no service apportionment.
1.40 percent_extension sum(appointment_apportionment_percent_extension_fte) / sum(appointment_apportionment_fte) for unit. This is set to zero when there is no extension apportionment.
1.41 percent_admin sum(appointment_apportionment_percent_admin_fte) / sum(appointment_apportionment_fte) for unit. This is set to zero when there is no admin apportionment.
1.66 t_tt_headcount_2014_2023_avg The average of the full-time employees with faculty status who are on the tenure track or tenured as reported to the National Center for Education Statistics IPEDS Data Center. Headcounts were assigned to departments using the HR tenure org unit.
Warning C.5: Research Contributions by NTT Professors
Our department had a long-time Professor of Practice, Kathy Hanford, who had a research and teaching apportionment and was the professor in charge of the SC3L. She retired at the end of 2023, so she should be included in most of our metrics, but isn’t because she was not tenure track. She does, however, count against our budget. Her research productivity, grant productivity, and collaborations across campus should count when evaluating the department’s importance within UNL, but they do not currently. The focus on tenure track positions to the exclusion of all others is incredibly damaging, particularly when a department is as small as we are. If Kathy had been hired more recently, the position would have likely been tenure track (and when the position was posted to find her replacement, it was posted as tenure track). The current head of SC3L, Dr. Reka Howard, is an associate professor in the department.
Warning C.6: Per-capita measures
Different denominators are used to measure per-capita productivity in teaching and research across the analysis. In some cases, these are reasonable (e.g. it is reasonable to use total teaching FTE to calculate SCH per FTE values), but in others, these differences seem to arise primarily from the desire to conform to Academic Analytics or AAU metrics. While it is understandable that our administration wants to use metrics from other organizations rather than develop their own (this document exists because they don’t have the statistics training to design effective measures of variables of interest), this leads to significant and strange differences in productivity measures. It would be a far more coherent overall analysis if admin had used a single set of FTE measures consistently, rather than switching these measures up for different variables.
1.50 vsip_eligible_n The count of VSIP-eligible tenure-track faculty as of summer, 2026. If this follows past methodology, this is the count of faculty who:
- are tenured
- are 62 years of age as of their eligibility date: June 30, 2026 (FY contract length) or August 27, 2026 (AY contract length)
- have 10 years of service as of their eligibility date
This is an estimate. At present, it is impossible to determine how many would meet the final criterion: No accepted retirement contract/letter in place.
1.51 vsip_eligible_pct The proportion of the unit’s tenure-track faculty who would be eligible for VSIP in summer, 2026.
Warning C.7: VSIP percentage
Tracking this makes sense, but it’s unclear how this metric might factor into a final decision to combine or eliminate departments. Is it better to eliminate a department with a high percentage of VSIP eligible faculty, since the department might not be able to function after VSIP anyways? Or would it be better to eliminate a department without VSIP eligible faculty, since those savings won’t be double-counted by both VSIP and the elimination of the department, as the current analysis seems to do for the departments which will be combined (ALEC and Agricultural Economics, Entomology and Plant Pathology).
C.2 Research
Warning C.8: Z-scores for research
There are so many problems with the constitutent components of the research metrics (even before they are standardized) that the resulting research average z-score is utterly unreliable and not useful for cross-department comparison.
Fundamentally, as statisticians, if you take the average of standardized garbage, you still get garbage. Garbage in, garbage out, or GIGO, is a fairly standard abbreviation used to describe this problem.
1.57 research_average (Research Average z-score) Average research z-score with non-departmental units (including Dean’s offices) removed.
1.58 research_avg_z_score_equally_weighted Alternate calculation of research average with non-departmental units included in population with zero research productivity.
1.83 comments Comments from ORI regarding research metrics, their crosswalk to instructional units, etc.
C.2.1 SRI
1.82 sri_aau_public_peers Academic Analytics SRI score when comparing units to Public AAU Institutions. If a unit has multiple SRI scores available, they were averaged.
The Scholarly Research Index (SRI) is a measure developed by Academic Analytics to evaluate the research performance of individuals and entities with respect to
- scholarly products, such as conference proceedings, research articles, books, and book chapters,
- recognition from the community in form of citations and awards, and
- federal sponsoring of research projects measured by the number of grants and their amounts.
Different disciplines operate differently. The weighting of each of these measures is therefore adjusted discipline specific (based on a factor analysis by Academic Analytics).
1.59 sri_aau_public_peers_z_score Z score of sri_aau_public_peers
Warning C.9: SRI Problem 1 - Averaging Multiple SRI scores
Some departments have multiple SRI scores generated by Academic Analytics.
In some disciplines, departments might be book-focused or article focused, or might have members with different focuses. Examples in Figure B.1 include Communication Studies, Sociology, Advertising, Landscape Architecture, Interior Design, and Broadcasting, among others.
Another reason a department might have multiple SRI scores is that it is composed of multiple different disciplines. Examples in Figure B.1 include Agronomy & Horticulture, Earth and Atmospheric Sciences, the School of Computing, Physics and Astronomy, and Electrical and Computer Engineering.
When there are two different norms within a discipline, SRI scores were reportedly averaged to create a mean SRI value. This is incorrect - because these values have different distributions, averaging them does not produce a meaningful result with a valid comparison distribution. A more reasonable combination method would be to evaluate each score to get a distributional measure (quantile, percentile, rank), and then to take the maximum of that measure - the departments peers would know what the focus area of the department is and which focus would be more appropriate.
In the case of a hybrid department, the scores were also averaged. This approach is also not reasonable, as SRI distributions are not the same across disciplines. It is critically important to go through the distribution, calculating a rank, percentile, or quantile rather than using averages. Then, if the goal is to assess the department’s performance, two reasonable approaches could be used to aggregate the percentile or quantile scores:
- take a weighted average of the percentile or quantile scores, with weight determined by the composition of the department.
- take the maximum of the percentile or quantile scores in order to assess the overall opinion of the work done within the department in a community of peers. This makes more sense if the goal is to model how other people see UNL’s departments, as people tend to remember outstanding work in the field more than they remember or consider average work.
Warning C.10: SRI Problem 2 - Cross-Department Comparisons
It is completely inappropriate to use SRI values to compare departments to other departments within the same university. SRI values have a distribution that is discipline specific, with different means and variances. As-is they are not comparable outside of that distribution, as shown in Table C.2
| Unit | SRI | SRI Percentile | Number of Units |
|---|---|---|---|
| Agronomy and Horticulture, Department of | 0.4 | 92.31 | 26 |
| Computing, School of | 0.4 | 91.38 | 325 |
| Modern Languages and Literatures, Department of | 0.4 | 85.84 | 219 |
| Accountancy, School of | 0.4 | 82.93 | 205 |
| Educational Administration, Department of | 0.4 | 79.38 | 160 |
| Statistics, Department of | 0.4 | 75.80 | 157 |
| Teaching, Learning and Teacher Education, Department of | 0.4 | 74.68 | 79 |
| Special Education and Communication Disorders, Department of | 0.4 | 73.68 | 95 |
| Agricultural Leadership, Education and Communication, Department of | 0.4 | 71.28 | 94 |
Calculating a mean and standard deviation to create a z-score for SRI values across disciplines destroys any information which could have been found in the SRI measure.
Note that this is not an objection to SRI as a concept. It seems that SRI is a more fair method of comparison than other attempts to replicate SRI used in the budget reduction process, because at least all departments across a discipline are compared using the same (sometimes flawed) data1. As it is, the metrics assembled by UNL, while applied to all departments equally, have unequal effects on different departments because the metrics used favor one discipline over another due to norms within that discipline. The problem with SRI is that it must be used in the context for which it was intended: comparing departments to other similar departments. The misuse of SRI results in eliminating programs which compare perfectly well to both Academic Analytics institutions and to AAU peers, as shown in Figure 4.1.
While we do not have access to the complete data for all departments and their comparison units, we do have access to the statistics data, which is shown in Figure 4.2. The statistics department’s SRI value is at the top of the non-AAU R1 institutions, and is well within the bounds of the SRI range of AAU institutions. Note that we would not expect that a department be at the top of the AAU university SRI values (which is why the custom SRI score isn’t that useful, though the percentile is somewhat helpful) – what is necessary is for the department’s SRI to be above the minimum (preferably comfortably above) of the comparable AAU department SRI values.
Problem Under the UNL proposed method (using the SRI relative to public AAU institutions), it seems that custom SRI is used instead of percentile. This renders any calculations done on SRI, and any calculations which use sri_aau_public_peers or sri_aau_public_peers_z_score, functionally meaningless as they are not comparing values drawn from the same distribution to each other. Without a common reference distribution, it is inappropriate to pool values by calculating a common mean and variance, and then to use that common mean and variance to produce a z-score.
Solution SRI should be converted to a percentile (or corresponding quantile, if the goal is a z-score), and in disciplines without sufficient comparison departments, there will be a lot of variability in the percentile (which should be treated as an estimate). SRI should be used to evaluate research productivity instead of attempting to create a multi-metric that adds additional weight to awards, books, citations, and grants x3, as Academic Analytics has already done the factor analysis to determine which of these are relevant to which disciplines.
Theory & Statistical Rationale The Glivenko-Cantelli theorem guarantees that as \(n\rightarrow\infty\) the empirical CDF (eCDF) converges to the distribution CDF demonstration via WolframAlpha. While there is no guideline for sufficient \(n\), the eCDF will be extremely blocky and step-function like at first, and as \(n\) increases, the average distance between discontinuity points will decrease, producing an increasingly smooth function. The variance of the estimated percentile can be estimated by treating the percentile as a proportion and using a binomial confidence interval to get a sense of the variability. Then, this binomial confidence interval can be mapped back to normal quantiles if a z-score range is desired.
Warning C.11: SRI Problem 3 - Comparison Groups and TMFD
The case of Textiles, Merchandising, and Fashion Design illustrates the problem of comparison groups quite nicely. TMFD is in the bottom quintile - ranked 25 out of 41 peers - in Figure 4.1. Except the department should have 127 peers, because every land-grant university has a similar department. Looking more closely, we find that the peer group for the department in Academic Analytics is listed as “Consumer and Human Sciences, various”. Word of caution: whenever someone describes your work as ‘something with’, ‘various’, or ‘whatever’, they don’t really know what you are doing. So why doesn’t Academic Analytics know what TMDF does?
Academic Analytics uses CIP (Classification of Instructional Programs) codes defined by the National Center for Education Statistics to create peer groups. Merely glancing over the Textile related cip codes, it is clear that there are more fitting choices than ‘Consumer and Human Sciences, various’:
| CIP Code | Program Name |
|---|---|
| 19.0901 | Apparel and Textiles, General |
| 19.0902 | Apparel and Textile Manufacture |
| 19.0904 | Textile Science |
| 19.0905 | Apparel and Textile Marketing Management |
| 19.0906 | Fashion and Fabric Consultant |
| 19.0999 | Apparel and Textiles, Other |
So why does Academic Analytics not pick a better peer group for comparisons?
It turns out, that Academic Analytics relies on the submitting organization to provide CIP codes:
CIP Codes (to units and Ph.D. programs as classified in institution’s system) Note that while CIP Codes are referenced in the creation of the Academic Analytics Taxonomy and are requested in the submission instructions, they are currently used for reference only. Reporting by CIP is not available. Not all requested fields are available in the comparative database. Some data remain incomplete because institutions have not submitted those fields. However, they are archived because they may prove useful for clients and Academic Analytics, particularly in the data matching processes.
So, at some point someone at UNL listed TMFD as “Consumer and Human Sciences, various” instead of the proper CIP code, and it is TMFD’s job to find the error, get someone in ORI to listen to the problem and fix the error, and then hope that the metrics are updated before their APC hearing. Ultimately, there just is not enough time for that process to occur, even if ORI was willing to engage and fix the analysis.
C.2.2 Awards
1.68 awards_ltd_2023_total NCR highly prestigious awards, including national academy memberships in engineering, medicine and science. The data source AAU uses for highly prestigious awards is Academic Analytics (AcA) and only awards for T/TT faculty in benchmarked AcA units is reported to the AAU. Highly prestigious awards are tracked over the life of the faculty member’s career and are credited to the institution where they are currently employed. Once a faculty member retires or leaves an institution, their highly prestigious awards are no longer included in the data reported to AAU. Put another way, the highly prestigious awards follow the faculty member. From the AAU Membership Policy: AAU collects the number of faculty members by institution receiving awards, fellowships, and memberships in the National Research Council (NRC) list of highly prestigious awards that included: research/scholarship awards, teaching awards, prestigious fellowships or memberships in honorary societies. Each data year represents the faculty’s lifetime honors and awards, not new honors and awards. University of Maryland, College Park data includes University of Maryland, Baltimore beginning in 2019. The Faculty Scholarly Productivity (FSP) Database. These data are reproduced under a license agreement with Academic Analytics. http://academicanalytics.com/ . The list of the NRC highly prestigious awards can be found at: National Research Council List of Highly Prestigious Awards | Association of American Universities (AAU). Memberships in the National Academies (NAS, NAE, NAM) compiled from the membership lists of each academy; lists can be found at: National Academy of Sciences: http://www.nasonline.org/member-directory/, National Academy of Engineering: http://www.nae.edu/default.aspx?id=20412, National Academy of Medicine: https://nam.edu/directory-search-form/
Warning C.12
Award comparisons should be made within discipline, not across disciplines, as the AAU list of prestigious awards does not include the AERA awards for education. As the national academies listed do not induct professors teaching in education, it is irrational to compare e.g. the physics department, whose members could conceivably be inducted into the NAS, NAE, or both depending on the subfield. This is one reason why Academic Analytics compares within discipline and not across disciplines.
1.79 awards_normalized awards_ltd_2023_total divided by t_tt_headcount_2014_2023_avg.
1.63 awards_normalized_z_score Z score of awards_normalized Normalized highly prestigious awards, fellowships and memberships as defined by the AAU membership policy for awards received LTD up to 2023. Data is normalized by the average T/TT faculty headcount over the same time period as reported to IPEDS.
C.2.3 Books
1.69 books_2014_2023_total The total number of books published over the time period 2014-2023. The data source AAU uses for highly prestigious awards is Academic Analytics (AcA) and only books published for T/TT faculty in benchmarked AcA units are reported to the AAU. Book publications reported to AAU by AcA include books, casebooks, edited volumes, encyclopedias, and textbooks. AcA book types not reported include journals, proceedings, study guides and book chapters. Book publications are credited to departments based on the author’s HR tenure org unit. From the AAU Membership Policy: The total number of books published by the institution for the most recent ten-year period. The Faculty Scholarly Productivity (FSP) Database. These data are reproduced under a license agreement with Academic Analytics. http://academicanalytics.com/
1.80 books_normalized books_2014_2023_total divided by t_tt_headcount_2014_2023_avg
1.64 books_normalized_z_score Z score of books_normalized Normalized book publications as defined by the AAU membership policy for the time period of FY2014 to FY2023. Data is normalized by the average T/TT faculty headcount over the same time period as reported to IPEDS.
Warning C.13: Book Disciplines and Book Data
While the book data from Academic Analytics is overall quite high quality, it does have some issues in that it is dependent on publisher reporting. The statistics department found at least one book which was misreported by the publisher, affecting the totals. More importantly, individuals do not have access to Academic Analytics – typically, only unit leads have access. Unit leads have neither the time nor the precise information to audit this information for correctness and follow up to ensure that it is fixed. These errors are likely more consequential for small departments, particularly in disciplines that are not book-centric as measured by Academic Analytics weights.
Books published by faculty members in the department during the decade-long interval are not included if the faculty member left the department or retired before 2024, despite the fact that these individuals contributed to the reputation of the department during the decade of interest. Dr. Walter Stroup published 3 extremely well-respected and popular books between 2014 and 2023, but these are not counted in the department metrics, even though Dr. Stroup was a past chair of the department and is an important part of our reputation for excellence, even after his retirement.
In addition, books are normalized by average tenure-track headcount without accounting for apportionment. Most (but not all) books published are research-centric, with textbooks as the exception. However, even textbooks are typically written while on research leave. As a result, it is probably more reasonable to normalize this value by average research FTEs rather than average number of tenure-track FTEs.
C.2.4 Citations
1.70 citations_2014_2023_avg The average number of citations on peer-reviewed articles for the most recent ten-year period. AcA reports citations in the year of the publication. Citations for articles coauthored by more than one UNL faculty member have been split equally across authors. AAU uses Web of Science InCites for the citations data. UNL does not currently subscribe to InCites and so is using Academic Analytics to track and report this data. Citations are credited to departments based on the author’s HR tenure org unit. From the AAU Membership Policy: Average number of times an institution’s Web of Science Documents have collectively been cited for the most recent ten-year period. InCitesTM, Clarivate (2023). Web of Science. ® These data are reproduced under a license agreement from Clarivate. http://incites.clarivate.com/
Warning C.14: Citation Window
The choice to use Academic Analytics citations is not discipline-neutral. The InCites citation window is 10 years, which is long enough for most disciplines. However, Academic Analytics citation counts for the statistics department are lower than the corresponding citation counts from InCites – 77 vs. 127 for Susan Vanderplas, for example. In some disciplines (statistics, math), papers can reach peak average citation frequency after 15 years or more (Galiani & Galvez 2017).
Galiani, Sebastian and Gálvez, Ramiro H., The Life Cycle of Scholarly Articles Across Fields of Research (May 2, 2017). http://dx.doi.org/10.2139/ssrn.2964565
When interpreting 10-year citation counts, it is also important to consider the age of the department. For instance, consider Dr. Vanderplas, who received her Ph.D. in 2015. It is unlikely that she had any highly cited papers before she received her Ph.D., and even unlikely in the years immediately after receiving her Ph.D., as young researchers are often not cited as frequently as more established colleagues. A department made up of primarily assistant and associate professors will be at a very large disadvantage relative to more established departments. If the number of people in the department is also small, the variability in citation counts also becomes a factor.
1.81 citations_normalized citations_2014_2023_avg divided by t_tt_headcount_2014_2023_avg.
Warning C.15: Citation normalization
Normalizing citations by tenure-track headcount instead of by effective research FTE is problematic. Some departments have a significant number of non-TT faculty in research/extension positions who contribute to the scholarly literature in their field. In addition, some departments have a vastly different apportionment between research and teaching, and this would translate into different publication rates and accumulation of citations.
These factors are more critical when they are used to compare across departments within a university – when Academic Analytics makes comparisons using tenure-track headcount, that leaves out some information, but it would be expected to hurt similar departments similarly. This is not the case when using these metrics to compare across departments – in these situations, discipline specific norms must be accounted for in some way.
1.65 citations_normalized_z_score Z score of citations_normalized Normalized citations as defined by the AAU membership policy (using Academic Analytics as a proxy for InCites) for the time period of FY2014 to FY2023. Data is normalized by the average T/TT faculty headcount over the same time period as reported to IPEDS.
Warning C.16: Citation counts
Citation counts differ wildly by discipline, and are affected both by how many researchers and papers there are in the discipline and by citation norms within that discipline. Using z-scores makes the assumption that all departments are from a similar distribution (which is clearly not the case). Comparing departments on normalized citations ensures that these discipline-specific norms dominate the signal, which biases a metric that might have been intended to indicate department research quality and reception so that it just becomes a signal for citation norms and research appointment practices.
C.2.5 Research Awards Inc NUF
Warning C.17: Grant Metric Problems
All of the grant metrics are affected by a common flaw: disciplines do not (usually) compete against each other within a university for awards2. Rather, the English department might get awards from the National Endowment for the Arts or various private foundations. The Physics department likely gets grants primarily from NSF, and Engineering departments have some options - NSF, Dept of Energy, Department of Defense. Life sciences might get grants from NSF, but also NIH, CDC, Dept of Health, and the Veterans Administration. Agriculture grants will primarily come from USDA but may also come from NSF, NIH, and others because ultimately agriculture spans both applied and hard science topics across a wide range of applications.
What is important about this is that the amount of funding available (and size of available grants) is dramatically different between departments. That is, departments cannot be thought of as one single population! It is clear that someone putting these metrics together paid enough attention in a statistics class to remember how to compute a z-score, but apparently they missed the part where it makes no sense to compute z-scores when you don’t have a defined reference population. Or, in this case, when you absurdly claim that something that is clearly a mixture of several populations can be used as a single reference population.
Ignoring population heterogeneity (having multiple groups with different values in a population) is a common precursor to Simpson’s paradox, where a trend of the overall data reverses direction once the groups are accounted for in the model. Without the raw data for the individuals across the university, we cannot conclusively demonstrate that this is what is happening, but it seems possible. Alternate explanations are that the data quality is not particularly good (also possible). In any case, the research award metrics ultimately cannot be used for doing more than differentiating low-grant fields from high-grant fields.
In addition, smaller departments will have more variability in grant funding year-to-year than larger departments. When funding rates are low (10-20%), small departments may have $0 grant funding in one year and several awards come through in subsequent years, while large departments will have a more consistent funding level. While it is not clear how funding is counted on an annual basis (e.g. whether research_awards_growth_inc_nuf_fy2020_total_research_awards counts awards which started in 2020, were awarded in 2020, or incremental funding on multi-year awards that happened to be received by the university in 2020), if funding is counted at the award level and not the amount received per year, this measure gets to be even more “lumpy” and inconsistent from year to year. When taking a ratio of differences, as in research_awards_growth_inc_nuf_percent_of_total, this inconsistent behavior becomes even more problematic. It would be far better to fit a trend line with 4 or even 10 years of per-capita funding data to each department, and then do inference based on the slope of that line, generating a confidence interval or even a z-score for the slope of the line. Note that we do not recommend comparing departments based on that z-score, because the amount of funding available will be conditional on the department discipline, and picking winners and losers within UNL based on federal grant funding availability is short-sighted. Metrics are useful for description even when they are not used for inference.
Warning C.18: Problems with
research_awards_growth_inc_nuf_fy20_fy24
Of all of the random variables created in this analysis, the most problematic from a statistical theory perspective might be research_awards_growth_inc_nuf_fy20_fy24 (and its instructional companion, instructional_sch_4Y_share_growth). This is the ratio of two differences, where we might reasonably model each value in the numerator as a normal random variable with mean \(\mu_d\) and standard deviation \(\sigma_d\) (\(d\) for department), and each value in the denominator as random variables with mean \(\mu_u\) and standard deviation \(\sigma_u\) (\(u\) for university). The problem with this is that the two differences, \(\mu_{d,2024} - \mu_{d,2020}\) and \(\mu_{u,2024} - \mu_{u,2020}\) have mean zero, which leads to a \(\frac{0}{0}\) situation that is mathematically undefined.
In statistical terms, if the numerator and denominator have mean 0, then the random variable representing the ratio is Cauchy distributed. Cauchy distributions are heavy-tailed (values far away from the mean are much more likely than they would be with a normal distribution), that is, they generate extreme values more frequency. Cauchy distributions are difficult to work with because they do not have a (meaningful) mean or a standard deviation. It is possible to generate draws from a Cauchy distribution, and even to take the mean and standard deviation of those draws, but the values do not describe anything useful about the underlying data. The mean will never converge to a single value, even with a million or billion samples, unlike nearly every other common distribution.
As a result, calculating the z-score for something that has or might be expected to have a Cauchy distribution is fundamentally problematic, because neither the mean or the standard deviation will have any real-world meaning or even be numerically stable. The Central Limit Theorem requires that variables have finite variance precisely because of the counterexample of the Cauchy distribution.
Cauchy random variables are typically not covered in undergraduate math-stat and probability courses, except perhaps a mention in passing. That they arise so readily in this type of analysis is just another example why it is fundamentally necessary to have graduate statistical training or oversight in order to use complex functions of random variables to make practical decisions that will hold up under scrutiny.
1.74 research_awards_growth_inc_nuf_fy2020_total_research_awards Total sponsored research awards received in FY2020. Included are all sponsor types: federal, industry, state agencies, associations/nonprofits and the NU Foundation. This includes purpose code research only. Awards are credited to departments using NuRamp routing forms. For PI/co-PIs who routed their credit through a unit outside a department, efforts were made to credit a department using the individual’s HR tenure org unit, primary org unit and any secondary appointments.
1.75 research_awards_growth_inc_nuf_fy2024_total_research_awards Total sponsored research awards received in FY2024. Included are all sponsor types: federal, industry, state agencies, associations/nonprofits and the NU Foundation. This includes purpose code research only. Awards are credited to departments using NuRamp routing forms. For PI/co-PIs who routed their credit through a unit outside a department, efforts were made to credit a department using the individual’s HR tenure org unit, primary org unit and any secondary appointments.
1.76 research_awards_growth_inc_nuf_fy20_fy24 research_awards_growth_inc_nuf_fy2024_total_research_awards minus research_awards_growth_inc_nuf_fy2020_total_research_awards Growth of sponsored research awards from FY20 to FY24. Included are all sponsor types: federal, industry, state agencies, associations/nonprofits and the NU Foundation. This was calculated by taking the dollar growth over the time period of FY24 – FY20 as a percentage of total growth for the institution resulting in that unit’s share of the overall growth dollars for the institution over the reported time period.
1.77 research_awards_growth_inc_nuf_percent_of_total research_awards_growth_inc_nuf_fy20_fy24 for the department/unit divided by research_awards_growth_inc_nuf_fy20_fy24 for UNL as a whole
1.61 research_awards_growth_inc_nuf_z_score Z score of research_awards_growth_inc_nuf_fy20_fy24
C.2.6 Total Sponsored Awards Inc NUF RSCH PUB SERV TEACH
1.71 average_total_sponsored_awards_inc_nuf_rsch_pub_serv_teach_fy2020_fy2024 Average annual sponsored awards received in FY20 to FY24. Included are all sponsor types: federal, industry, state agencies, associations/nonprofits and the NU Foundation. Purpose codes reported include research, teaching and public service which are summed and divided by total state appropriated budget. Awards are credited to departments using NuRamp routing forms. For PI/co-PIs who routed their credit through a unit outside a department, efforts were made to credit a department using the individual’s HR tenure org unit, primary org unit and any secondary appointments.
1.73 total_sponsored_awards_inc_nuf_rsch_pub_serv_teach_avg_awards_budget Average_total_sponsored_awards_inc_nuf_rsch_pub_serv_teach_fy2020_fy2024 divided by budget_from_evc_file_state_appropriated_budget Average sponsored awards for FY20-24. Included are all sponsor types: federal, industry, state agencies, associations/nonprofits and the NU Foundation, for purpose codes research, teaching and public service divided by total state appropriated budget.
Warning C.19: Problems with total_sponsored_awards_inc_nuf_rsch_pub_serv_teach_avg_awards_budget
It’s unclear why the total_sponsored_awards_inc_nuf_rsch_pub_serv_teach_avg_awards_budget indicator was divided by total state appropriated budget, but the numbers for Statistics grants are all over the place. For instance, if we multiply the 0.362 value for statistics (before it is converted to a z-score) by the state permanent budget from 2025-26, we get 4.8118524^{5}. One PI in the department brought in 1.2 million dollars in grant money during the 2020-2024 period. Thus, we have had a difficult time validating these numbers in any way.
1.60 awards_budget_inc_nuf_z_score Z score of total_sponsored_awards_inc_nuf_rsch_pub_serv_teach_avg_awards_budget
C.2.7 P1 Expenditures
1.67 p1_expenditures_2014_2023_avg The average competitively funded federal research support as defined by the AAU membership policy, federal research expenditures less USDA research expenditures adding in awards from USDA Agriculture Food and Research Initiative (AFRI). Expenditures and AFRI awards are credited to departments using NuRamp routing forms. For PI/co-PIs who routed their credit through a unit outside a department, efforts were made to credit a department using the individual’s HR tenure org unit, primary org unit and any secondary appointments. From the AAU Membership Policy: Competitively funded federal research support: federal R&D expenditures. A ten-year average of federal research expenditures (including S&E and non-S&E) adjusted to exclude USDA formula-allocated research expenditures. This indicator includes obligations for the AFRI program funded by USDA. National Science Foundation (NSF) Survey of Research and Development Expenditures at Universities and Colleges/Higher Education Research and Development Survey (HERD), data for the most recently available ten-year average. AFRI Obligations, data for the ten years that match the years from HERD.
1.78 p1_expenditures_normalized p1_expenditures_2014_2023_avg divided by t_tt_headcount_2014_2023_avg.
1.62 p1_expenditures_normalized_z_score Z score of p1_expenditures_normalized Normalized competitively funded federal research expenditures as defined by the AAU membership policy for the time period of FY2014 to FY2023. Data is normalized by the average T/TT faculty headcount over the same time period as reported to IPEDS.
C.3 Teaching
Warning C.20: Data Lockout and Validation
It is hard to validate the teaching metrics, because the administration has directed the registrar’s office and the graduate college “not to distribute data related to proposed budget reductions at this time” (email between Sarah Zuckerman and Debra Hope, Graduate College).
The Statistics department had similar trouble getting data from Chad Brasil, though most of it could be assembled (sometimes manually) using published Tableau dashboards. As a result, it is much harder to comment on or validate the teaching metrics. There are likely similar problems with the way variables were assembled, but because of the administrative lockout, we cannot do the necessary detective work to identify those problems.
C.3.0.1 Enrollment
1.42 U_major_n Count of undergraduate majors, including non-primary majors. 1.44 G_major_n Count of graduate majors, including non-primary majors. 1.46 P_major_n Count of professional majors, including non-primary majors. 1.87 majors Sum of U, G, and P majors (all majors).
1.22 major_completions_bachelor_degree Count of all Bachelors completions within major (including non-primary majors).
1.24 major_completions_two_years_college Count of all graduate certificate completions within major (including non-primary majors).
1.26 major_completions_masters_degree Count of all Masters completions within major (including non-primary majors).
1.28 major_completions_doctorate_degree Count of all Doctorate completions within major (including non-primary majors).
1.30 major_completions_post_masters Count of all Post Masters completions within major (including non-primary majors).
1.43 U_primary_major_n Count of undergraduate primary majors.
1.45 G_primary_major_n Count of graduate primary majors.
1.47 P_primary_major_n Count of professional primary majors.
1.23 degree_n_bachelor_degree Count of all Bachelors degrees with attached major (primary)
1.25 degree_n_two_years_college Count of all graduate certificates with attached major (primary).
1.27 degree_n_masters_degree Count of all Masters degrees with attached major (primary).
1.29 degree_n_doctorate_degree Count of all Doctorate degrees with attached major (primary).
1.31 degree_n_post_masters Count of all Post Masters degrees with attached major (primary).
1.88 degrees Sum of Bachelors, Masters, Doctorate, and Post Masters primary degrees
1.89 ratio_completions_majors Ratio of all degree completions (all majors attached to a degree) to all majors, including non-primary.
Warning C.21: Completions to Majors for New Programs
The statistics department has a new undergraduate program that, for AY 2024 (the last AY with statistics), had two cohorts of students. These students are included in the denominator as majors, but could not possibly have completed the program. As a result, of course, the department looks like we have a large dropout rate or are otherwise performing poorly.
It would be more reasonable to exclude new majors from this count until the program is mature and has all cohorts filled. In prior years, the statistics department has hovered around a 25% - 28% completion ratio, which reflects that our MS students take approximately 2 years to finish and our Ph.D. students take between 4 and 6 years to finish. We fully expect that our ratio will return to about that level when our undergraduate program is mature (if, of course, the university decides to keep this program), but it will likely decrease until that point, because we continued adding students who will take 4 years to graduate in AY 2025, and our first cohort is not expected to graduate until 2026.
1.871 minors_U Count of all undergraduate students in one or more minors offered by the unit.
1.872 minors_G Count of all graduate students in one or more minors offered by the unit.
1.86 enrollment Sum of U, G, and P unduplicated AY headcount
1.94 average_enrollment Mean of unduplicated enrollment headcount by unit.
1.93 all_majors_share_growth Change in share (percentage) of total (duplicated) majors from AY2020 to AY2024.
1.53 retention_rate First-year to second-year retention rate (cohort = AY - 1).
1.54 avg_retention_rate Average of first-year to second-year retention rates of last 5 cohorts. Note that average retention rates for units with average starting cohorts less than 5 were nullified.
Warning C.22: Retention rates
Average retention rates for new programs were nullified, even if they were good. However, as discussed in Warning C.21, there was no such nullification for the ratio of completions to majors for new programs, even though this value is equally misleading when a program is too new to have graduates. Inconsistencies in how censoring for new programs is applied causes problems – it is important to think carefully about how to ensure that measures do not produce misleading results for edge cases.
1.55 grad_rate6 Six-year graduation rate (cohort = AY - 5). Graduation rate includes students that graduated from UNL.
1.56 avg_grad6 Average of six-year graduation rates of last 5 cohorts. Note that average graduation rates for units with average starting cohorts less than 5 were nullified.
Warning C.23: Graduation Rates Shouldn’t Be Pooled
Most undergraduate programs take 4 years to complete. Most MS programs take 1-2 years to complete. Ph.D. programs vary considerably, but post-MS work might take between 2 to 4 years to complete, assuming the MS work transfers.
It is utterly confusing, then, to compute six-year graduation rates when the expected time to degree completion is so widely variable – six years is enough time for 5 different MS cohorts to complete their degrees, but only 2-3 undergraduate and Ph.D. cohorts! It’s also not uncommon for statistics students to get an MS and a PhD within 6 years - are those students counted twice?
Ultimately, graduation rates should be computed separately for each program, and if those are then averaged somehow that would be at least potentially sensible. But it is important to consider expected time to degree when computing graduation rates.
C.3.1 SCH & Tuition
1.48 sch Sum of course SCH by owner of course subject code.
Warning C.24: 2020 anomalies
The SCH reported for AY 2020 are almost universally off by a factor of around 10. This anomaly needs to be tracked down and investigated, because while it may not affect any department differently, it puts the provenance of the data and the quality control measures in question. Systematic errors are a red flag to go back and consider whether the data quality is sufficiently high to be making decisions based on this data.
1.49 total_realizable_base_tuition sch by course career and student residency times base tuition rate. For AY2024, these rates were: Career | Resident | Non-resident — | — | — UG | $268 | $859 G/P | $353 | $1031
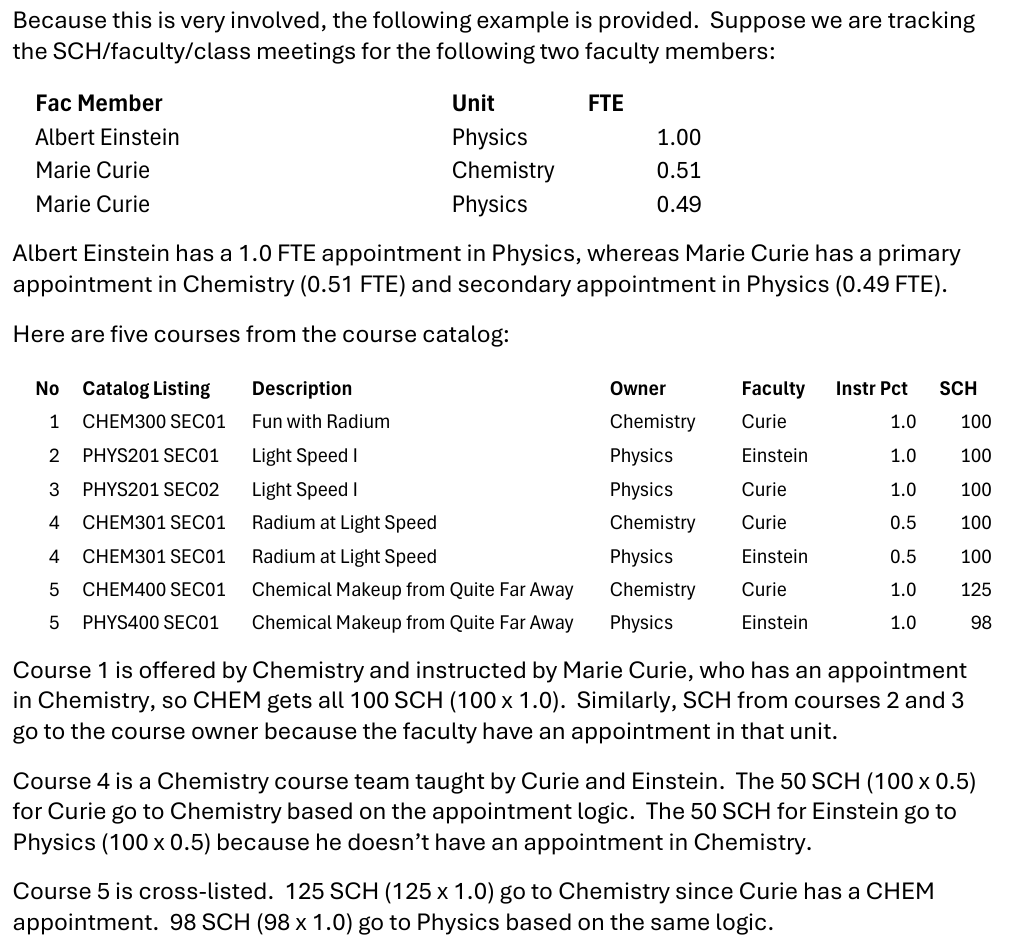
1.52 instructor_sch The logic for Instructional SCH is:
- If a course prefix maps to a “unit” that is instructed by a faculty member with an appointment in that “unit” then the SCH will be assigned to that “unit”.
- If a course prefix maps to a “unit” that is instructed by a faculty member WITHOUT an appointment in that “unit” then the SCH will be assigned to the “unit” where the faculty member has their largest percentage of appointment (primary appointment home).
- If a course maps to a “unit” that is instructed by a faculty member without an appointment e.g., no instructor of record recorded, then the SCH is assigned to the “unit” according to the course prefix.
1.84 instructional_sch Sum of SCH attributed to instructors’ home departments. The formula takes the percentages designated to each instructor in Peoplesoft. Sum(Section SCH x Instructor %)
1.90 instructional_sch_to_instructional_fte Instructional SCH divided by apportioned teaching FTE
1.91 average_instructional_sch Mean of instructional SCH by unit.
1.92 instructional_sch_4Y_share_growth Change in share (percentage) of total instructional SCH from AY2020 to AY2024.
Warning C.25: Problem:
instructional_sch_4Y_share_growth
This is another variable which is likely Cauchy distributed (see Warning C.18), that is, it is the statistical equivalent of dividing by zero - the mean of the numerator is likely to be zero (in distribution) and the mean of the denominator is likely to be zero (in distribution) – each year’s SCH would be expected to be sampled from the same distribution at the department and university level.
The problem is that these variables do not have a distribution mean and have infinite variance. It is obviously possible to take the average of observations from this distribution, but the average will never converge (unlike samples from almost any other distribution - the average of an increasing number of samples will converge to the distribution mean, but only if the distribution has finite variance).
Taking a variable like this, and then calculating the mean and standard deviation across departments to standardize these variables makes this even more problematic, because it removes any meaningful information in the variable. Then, averaging these z-scores as part of an omnibus instructional z-score only serves to erase any meaningful information in the instructional z-score.
These problems exist in both the instructional and research z-scores, which renders the entire metric analysis statistically uninformative. Cauchy random variables are the bane of every statistics graduate student’s existence - they are primarily useful for counterexamples in proofs, but when they pop up in practice, they are always a pain to deal with, and if you don’t handle them correctly, they will ruin everything.
Unfortunately, the UNL administration will learn this the hard way, either by acknowledging the issue and reworking the budget reduction plan, or by eliminating highly ranked and high-performing departments because of a badly-executed statistical analysis.
C.3.2 Ratios
Warning C.26: Ratios are Stochastic Nightmares
The variability of calculated ratios complicates statistical analysis. While in some cases ratios are necessary, extreme care must be taken to ensure that there is no possibility of the ratio having a 0 in the denominator, either in observations or in the distribution (that is, it’s also bad if the distribution of the denominator has a mean of 0, even if no recorded observations actually have a mean of 0).
If a ratio is taken of variables with mean zero, the resulting random variable does not have a mean, standard deviation, or any other “statistical moments” (these variables have a Cauchy distribution, which does not have a mean). This does not mean that you can’t take the average of Cauchy distributed random variables – it only means that that number does not have any real-world meaning.
Even when the variables don’t have zero mean, taking ratios of numbers like this that have some stochastic noise can be problematic, as variability in the denominator has an outsized effect on the overall value.
1.85 budget_to_sch total original state aided budget divided by SCH
1.16 instructional_sch_to_instructional_fte Sum of each instructor’s section instruction percentage times section sch by home department of appointment divided by total_instructor_fte.
C.4 Instructional Z-scores in Institutional Metrics
All z-scores (also known as standardized or normalized scores) were calculated as the difference of the actual metric and the mean of the metric for included units divided by the standard deviation of the included units’ metrics.
It measures the number of standard deviations a metric is from the mean. In a normal distribution, approximately two-thirds of scores fall within +/- 1 standard deviation of the mean. Approximately 95% of cases fall within +/- 1.96 standard deviations of the mean. Traditionally – but not universally – cases beyond the 1.96 standard deviation threshold are considered outliers.
Warning C.27: Instructional Z-score Problem
While standardizing scores is common practice in some circumstances, it is problematic as used here, in part because it assumes that there is a single common distribution used for these values. For instance, disciplines that only have graduate programs cannot be assumed to have the same distribution of SCH because of much lower numbers of graduate students. It is utterly ridiculous to compare these programs to programs such as math or english who teach large numbers of nonmajor undergraduate service courses and will have SCH values on a vastly different scale. Departments do not have quantities which can be said to be “identically distributed” (in statistical parlance) even if you assume that the instructional metrics are reflective of a distribution of department performance, because not every department is competing in every pool. At minimum, it would be necessary to do some assessment of whether a course is primarily taken by majors or nonmajors, and then compare service teaching load separately from major teaching load, and undergraduate hours separately from graduate hours. Even under this system, it is probably necessary to “bin” departments based on the number of service courses taught/required on an annual basis, because e.g. Math will teach Calc 1, 2, 3, but Chemistry might teach an elective introductory course that counts for a science prerequisite, and the structural differences between these two departments and their relationship to other majors offered on campus matter significantly. While these factors are related to department productivity, no amount of work by the EDAD department is going to ensure that they teach every undergraduate STEM major an introductory service course, and as such it is ridiculous to compare SCH between EDAD and MATH or PHYS or STAT.
Moreover, the description of interpretation implies that these are normally distributed variables, but e.g. share of growth is necessarily confined to a value between 0 and 1, which is decidedly not normal because the normal distribution has support over the entire real line (that is, every value between \(-\infty\) and \(\infty\) has a positive, theoretically non-zero probability, though of course the values far from the mean of the distribution are expected to be infinitesimal).
When a metric consists of a ratio of two values, as many of these metrics do, it is even less likely that the random quantity has a normal distribution. In fact, if the numerator and denominator both have mean zero, the ratio is Cauchy distributed, and Cauchy variables do not have estimable means or variance – you can calculate a value for observed data, but it does not mean anything or converge to anything and is not an estimator of any useful quantity. While the problem is not quite as dramatic when the means of both distributions are nonzero, it is still important to be cautious because there are a number of different ratio distributions which might be relevant and not all of them are “nice”. This might be expected to be the case with a variable like budget_to_sch_2024, and it is almost certainly also true of instructional_sch_4Y_share_growth
Ultimately, just because you can calculate a z-value doesn’t ensure that it has meaning in the context of the data. Even if it would seem to have meaning, and every point is taken from the same reference distribution, if the values are ratios, it would probably be good to check with a statistician before proceeding, because it is very easy to end up in a nonsensical mathematical situation.
2.10 instructional_average Mean of instructional z-scores.
2.11 research_average (Research Average z-score) Mean of research z-scores
2.12 overall_average Mean of instructional and research average z-scores.
2.1 zinstructional_sch_4Y_share_growth Standardized instructional_sch_4Y_share_growth
2.2 zall_majors_share_growth Standardized all_majors_share_growth
2.3 zinstructional_sch_2024 Standardized instructional_sch_2024
2.4 ztotal_majors_n_2024 Standardized total_majors_n_2024
2.5 zinstructional_sch_to_instructional_fte_2024 Standardized instructional_sch_to_instructional_fte_2024
2.6 zbudget_to_sch_2024 Standardized budget_to_sch_2024
2.7 znet_realizable_tuition_less_budget_2024 Standardized net_realizable_tuition_less_budget_2024
2.8 zavg_retention_rate_2024 Standardized avg_retention_rate_2024
2.9 zratio_completions_majors_2024 Standardized completions (all majors) to majors.
2.14 instruction_weight percent_teaching / (percent_teaching + percent_research). This is set to zero when the denominator is zero.
2.15 research_weight percent_research / (percent_teaching + percent_research). This is set to zero when the denominator is zero.
2.13 weighted_overall_average Mean of instructional_average and research average weighted by instruction_weight and research_weight respectively.
2.16 mad_instructional_sch_4Y_share_growth Standardized instructional_sch_4Y_share_growth using median and median absolute deviation (MAD). MAD was scaled using sd(x) / mad(x, const = 1) method.
2.17 mad_all_majors_share_growth Standardized all_majors_share_growth using median and median absolute deviation (MAD). MAD was scaled using sd(x) / mad(x, const = 1) method.
2.18 mad_instructional_sch_2024 Standardized instructional_sch_2024 using median and median absolute deviation (MAD). MAD was scaled using sd(x) / mad(x, const = 1) method.
2.19 mad_total_majors_n_2024 Standardized total_majors_n_2024 using median and median absolute deviation (MAD). MAD was scaled using sd(x) / mad(x, const = 1) method.
2.20 mad_instructional_sch_to_instructional_fte_2024 Standardized instructional_sch_to_instructional_fte_2024 using median and median absolute deviation (MAD). MAD was scaled using sd(x) / mad(x, const = 1) method.
2.21 mad_budget_to_sch_2024 Standardized budget_to_sch_2024 using median and median absolute deviation (MAD). MAD was scaled using sd(x) / mad(x, const = 1) method.
2.22 mad_net_realizable_tuition_less_budget_2024 Standardized net_realizable_tuition_less_budget_2024 using median and median absolute deviation (MAD). MAD was scaled using sd(x) / mad(x, const = 1) method.
2.23 mad_avg_retention_rate_2024 Standardized avg_retention_rate_2024 using median and median absolute deviation (MAD). MAD was scaled using sd(x) / mad(x, const = 1) method.
2.24 mad_ratio_completions_majors_2024 Standardized completions (all majors) to majors using median and median absolute deviation (MAD). MAD was scaled using sd(x) / mad(x, const = 1) method.
2.25 pool_znstructional_sch_4Y_share_growth Standardized instructional_sch_4Y_share_growth within discipline pool.
2.26 pool_zall_majors_share_growth Standardized all_majors_share_growth within discipline pool.
2.27 pool_zinstructional_sch_2024 Standardized instructional_sch_2024 within discipline pool.
2.28 pool_ztotal_majors_n_2024 Standardized total_majors_n_2024 within discipline pool.
2.29 pool_zinstructional_sch_to_instructional_fte_2024 Standardized instructional_sch_to_instructional_fte_2024 within discipline pool.
2.30 pool_zbudget_to_sch_2024 Standardized budget_to_sch_2024 within discipline pool.
2.31 pool_znet_realizable_tuition_less_budget_2024 Standardized net_realizable_tuition_less_budget_2024 within discipline pool.
2.32 pool_zavg_retention_rate_2024 Standardized avg_retention_rate_2024 within discipline pool.
2.9 pool_zratio_completions_majors_2024 Standardized completions (all majors) to majors within discipline pool.
Academic Analytics analysts are very aware of the flaws in their data. If UNL wants to improve as an institution, one way to facilitate that would be to have PIs to ask e.g. federal grant agencies other than NIH and NSF to report data to Academic Analytics, as this would likely help us. Another option is for UNL to actually talk to analysts at Academic Analytics and to ensure that UNL follows statistical validation procedures that are as well thought out as AcA’s procedures.↩︎
The Fulbright program might be one common exception, as it allows applications from many different disciplines. However, this would likely fall under “Awards” more generally instead of research awards/grants.↩︎